With crawlers and log analyzers going to RUM and schema validators, this roundup delineates the best one of each tool and how to stack them for maximum efficiency.
Winning at SEO doesn’t come from flashy software or expensive subscriptions. It comes from smart choices, careful adjustments, and ongoing testing. In short, think of SEO like building a treehouse: the planner needs the right saw, drill, and level to spot weak branches and shaky supports. Below are the 10 apps that seasoned pros open for each big project. You’ll see how they link up for a complete health check of any site. Consequently, learning to use them makes educated guesses history-now it’s straight-up insight.
Google Search Console
What It Is
Search Console is a totally free dashboard from Google that shows what the search giant sees when it looks at your site. You won’t find fancy bells and whistles; however, it’s like the Rosetta Stone for rankings, clicks, and errors. It gives indoor and outdoor temp readings, so your SEO team knows when to adjust the air or patch the roof.
Why Pros Lean on It
Google Search Console (GSC) is where every tech audit must start. It’s like having the inside track with Google. The facts it shows aren’t guesstimates; they’re the most up-to-date details on what Google really thinks about a site. It also sends notifications about serious issues, like hacks or manual action warnings. As a result, those alerts need attention right away, or your rankings can dive sharply.
The big job of SEO is to help a page get found and stored in Google’s big library. Therefore, the Page Indexing report is the sharpest gadget in the toolbox, showing exactly why a page is missing from the library. For example, warnings like “Blocked by robots.txt” or “Not found (404)” point to the right fix in seconds. A page that’s not indexed can’t rank, so nothing else helps if it’s not in the index.
The Performance report links site health to business outcomes. It shows which search terms and pages draw clicks, helping us spot the keywords that are almost ranking on page one. Consequently, fixing technical barriers-like speeding up a slow page-can lift these “striking distance” terms to the top. Sending an XML sitemap through GSC helps Google discover new and revised pages quickly, too.
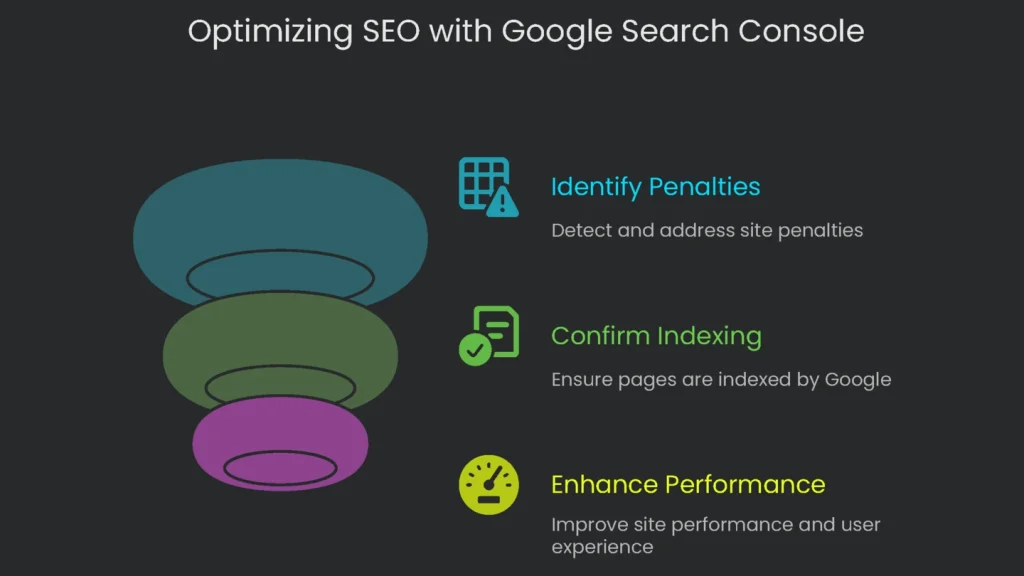
GSC’s dashboard orders technical insights by urgency.
- Top alerts always flag site-breaking problems.
- The next panels cover indexing issues.
- After that, sections on “Experience” and “Enhancements” show how to boost Core Web Vitals and earn rich results.
In short, a pro workflow sticks to this order: check for penalties, confirm indexing, then tackle performance.
Pro Tip
Pair the URL Inspection tool’s API with a crawler, like Screaming Frog. It scans indexing status for thousands of URLs in one go, speeding up audits after a site move or a major content refresh. Consequently, this cuts a slow, manual effort and turns it into fast, data-driven results.
Pricing Tier
Free.
Screaming Frog SEO Spider
What It Is
This powerful desktop app crawls websites to pinpoint everyday technical SEO glitches. It’s especially handy when auditing a whole site at once.
Why We Use It
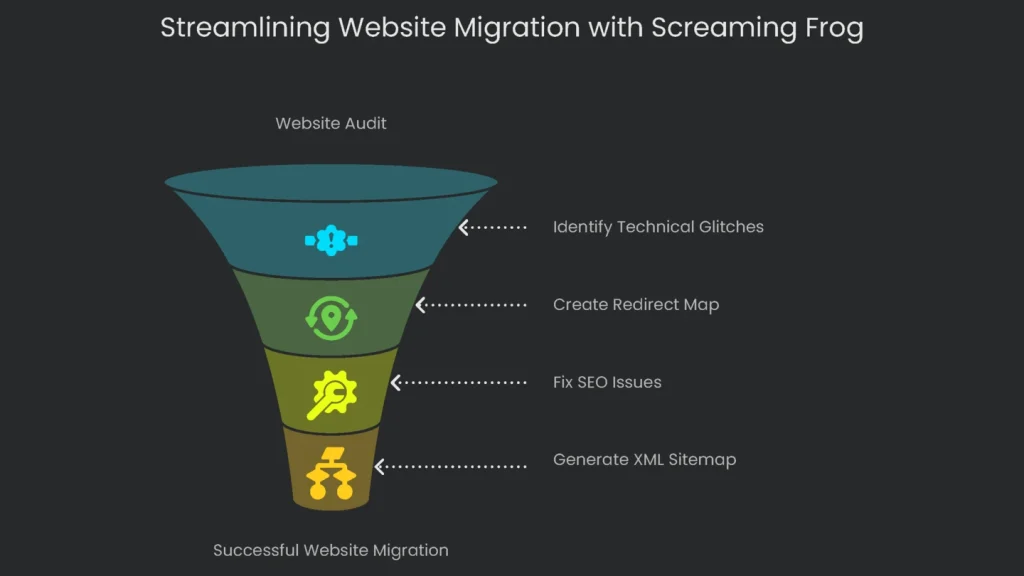
We shout “launch!” when a site transfer is green-lighted. Screaming Frog is the seatbelt. First, we scan the current site. It gives us the full URL list, server responses, title tags, and meta descriptions. Next, we paste that into tidy spreadsheets to draft the redirect map. This “What-goes-where” cheat sheet keeps Google happy and old visitors arriving at the right new pages. As a result, traffic slips shrink before the move starts.
Crazy-fast scans cut straight to show-stopping glitches:
- Dead links
- Error pages
- Long redirect chains that slow users and bog the crawl budget-how many pages the bots budget when crawling your site.
Once we spot the errors, we export neat reports. Devs get actionable lists, check the boxes, and we hit “safe move!” We also lean on the SEO Spider to scan titles and meta descriptions across the whole site. It finds pages with empty tags, duplicates, or long ones. Consequently, we fix them fast and boost click-worthiness in the search results. For complex sites, the Spider generates XML sitemaps, and we can tweak the settings more finely than most plugins allow.
Pro Tip
Open the Custom Extraction panel and use XPath, CSSPath, or Regex. This makes the crawler a mini data scientist. For example, you can yank out the author name from blog posts, grab product pricing from the shop, or fetch the publication date to flag stale articles.
Pricing Tier
Freemium (up to 500 URLs each month is free; more than that needs a paid plan).
Ahrefs or Semrush
What It Is
Ahrefs and Semrush are go-to, everything-in-one portals for site audits, link checking, keyword digging, and keeping tabs on what competitors are up to. Therefore, they anchor many technical SEO workflows.
Why We Use Them
When a site needs a deep dive, the tech SEO team doesn’t pick one because of fame. We grab the one that fits the specific fix. Each of these behemoths has spots where it leads, and we use that to help sites shine.
For example, Ahrefs stands out when you need to dive deep into backlinks. Its ever-growing archive of live backlinks is one of the biggest and most fresh around. That’s why the Site Explorer tool is great for reviewing a site’s backlink profile in detail. You can spot bad links that shouldn’t stick around, peek at competitors’ link plays, and follow how SEO juice moves through a site. Moreover, the layout is straightforward, so you can zip through these checks in no time.
Meanwhile, Semrush is like a Swiss Army knife for online marketing, going beyond SEO. You can tackle search, paid ads, content, and local listings in one spot. The Site Audit tool is a star, spitting out a must-fix list of technical issues, ranked for you, and telling you how to fix them in everyday language. As a result, when you feed log file info into a site audit, you get a fix list that reflects what real Google crawlers are doing. You then fix the stuff that really matters.
Pro Tip
In Ahrefs, the “Link Intersect” feature is super handy. Add the URLs of two or three strong competitors, then paste your domain into the “but doesn’t link to” box. That spits out every site that links to them but not to you. Consequently, you get a fresh list of high-potential prospects to email for backlinks.
For Semrush, connect the Site Audit tool to your Google Analytics and Search Console. This feeds the audit real shopping data and search data. Therefore, you can prioritize the tech fixes that hit your revenue the most. You’ll start fixing the pages that really matter, not just the ones that look broken.
Pricing Tier
Paid (Subscription-based).
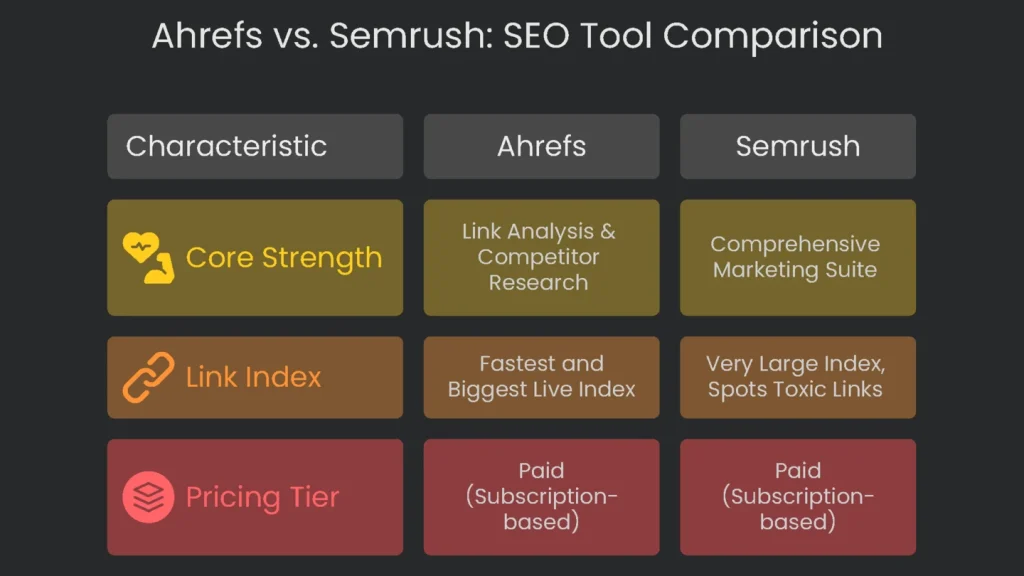
Ahrefs vs. Semrush: Key Differences
| Feature | Ahrefs | Semrush | The Bottom Line |
| Core Strength | Link Analysis & Competitor Research | Comprehensive Marketing Suite | Ahrefs digs deep into backlinks, while Semrush is for pros who want everything in one dashboard. |
| Link Index | Consistently the fastest and one of the biggest live link indexes. | Very large index, but with lots of historical data and the ability to spot toxic links. | Ahrefs is your go-to for fresh link chances, while Semrush is the tool of choice to scrub bad ones. |
Google PageSpeed Insights
What It Is
PageSpeed Insights (PSI) is a free tool that rates how well a single web page performs, blending computer tests with data gathered from actual users. It focuses on Core Web Vitals. To use it, paste your URL to see how your page stacks up and where to make easy improvements.
Why Pros Rely on It
Because page experience now counts as an official Google ranking factor, PSI has become a must-have gadget for modern technical SEO. It hands out an official report card for three key scores: Largest Contentful Paint (LCP), Interaction to Next Paint (INP), and Cumulative Layout Shift (CLS).
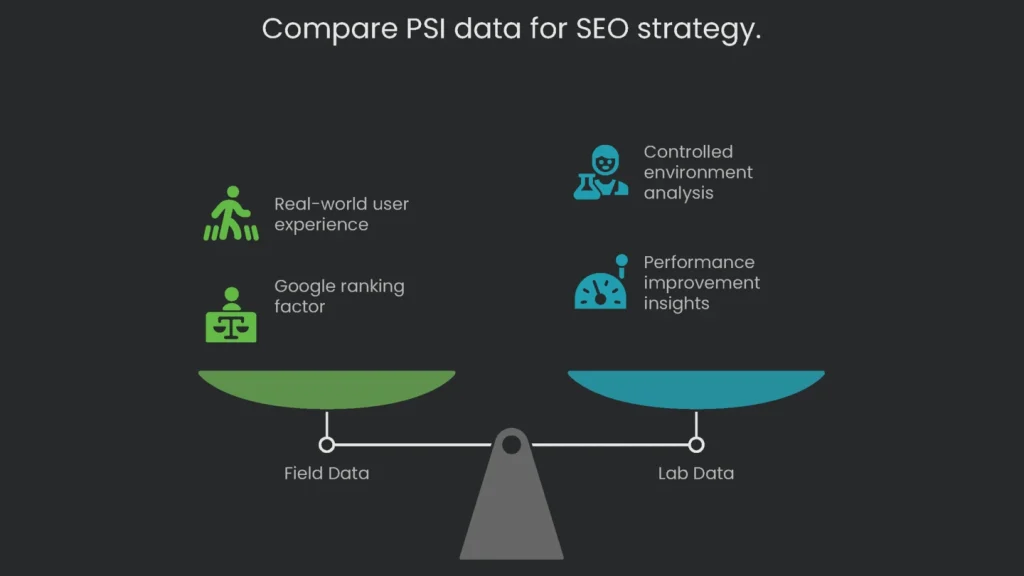
The real magic lies in two kinds of data:
- Field Data arrives via the Chrome User Experience (CrUX) report. It samples real Chrome users over the past 28 days and reveals how a page behaves on the street. This is the data Google weighs during ranking, so it tells the SEO team that the strategy is the real hit.
- Lab Data is churned out by Lighthouse inside a controlled environment. Even though it’s not the gold medal for ranking, it’s the plumber that patches the leaks. The reports lay out “Opportunities” for performance gains and “Diagnostics” that highlight ailments only the nitpickers know about.
Together, these views tune the page’s engine. Therefore, start with Field Data to spot real-world issues. If LCP drags there, circle back to Lab Data to locate and fix the cause. Consequently, you turn quick wins into long-term gains.
Quick Tip
Focus on more than the headline score. Scroll to “Diagnostics” and check “Avoid enormous network payloads.” It opens a Treemap of your JavaScript files. As a result, you see which scripts add the most weight and lag, not just generic advice to “cut unused JavaScript.”
Where to Get It
Price: Free.
GTmetrix
What It Is
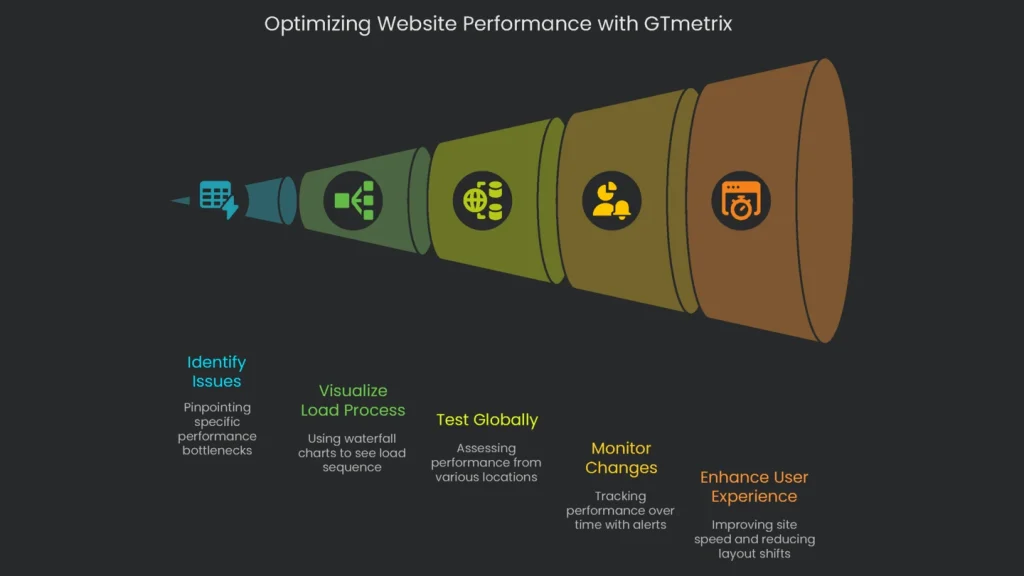
GTmetrix is a speed tool that drops in detailed reports. It gives you Lighthouse scores plus a waterfall chart to visualize exactly how the whole page loads.
Why We Use It
GTmetrix and PageSpeed Insights are buddies, not rivals. Working with both gives you the full picture. PageSpeed tells you what the issue is, while GTmetrix shows you why it happened.
The biggest reason we reach for GTmetrix is its waterfall chart. This view lays out every request the browser makes, showing the order, time, and size of each required file-things like CSS, JavaScript, and images. When a page drags, it’s the quickest way to spot the exact file blocking progress, the slow-loading third-party script, or that giant picture holding everything up.
GTmetrix goes beyond what PageSpeed can do. You can run tests from more than 20 spots on the globe, flip the connection speed, and pick from several device profiles. Consequently, you see how the site really feels on slow networks in different countries. For sites that change a lot, the monitoring tools are a lifesaver. With a Pro plan, you can run tests hourly or daily. If a key number takes a dive, you get an alert before the user notices.
Pro Tip
On a Pro account, enable “Video.” It snaps a frame-by-frame movie of the page as it loads, aligned with the waterfall chart. Therefore, when you spot a slow request, jump to that frame and see what the user actually sees-often a white screen. It quickly highlights sneaky layout shifts and gives clients a real-world preview of slow sites in action.
Pricing
Start with the Freemium plan. Basic checks are free. If you want monitoring or advanced features, switch to a paid plan.
Screaming Frog Log File Analyser
What It Is
This handy desktop app lets you drag and drop your server log files. It shows exactly how search engines and real visitors crawl a website.
Why We Use It
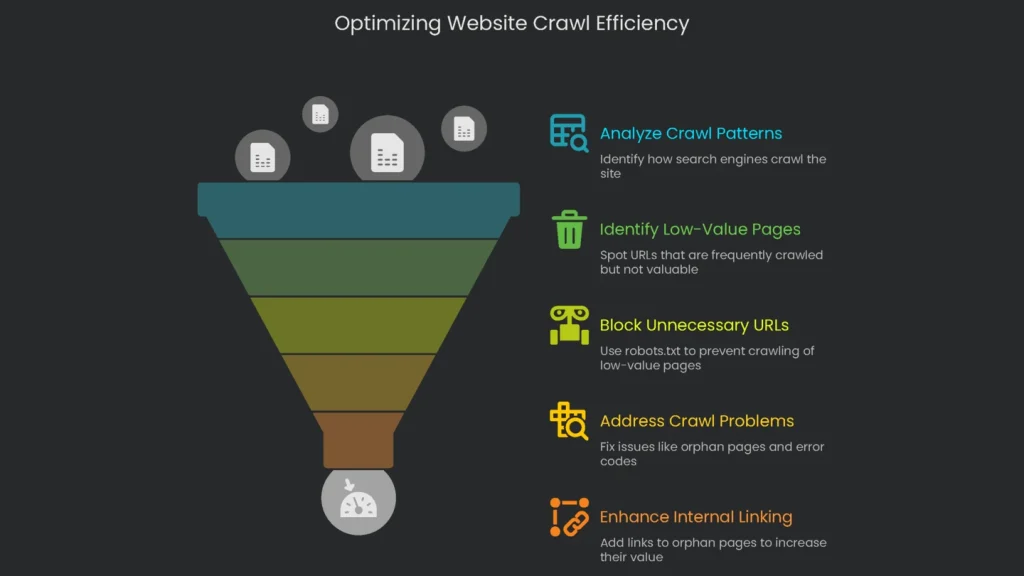
Instead of guessing how search engines work, the Log File Analyser gives you the straight story from the logs. This is vital for pacing how Google checks your pages. You can easily spot Googlebot hitting the same low-value pages over and over-like junk URLs or old redirects. Then you block those URLs in robots.txt. It’s a small win, yet it frees up crawl time for key pages that need attention.
The tool also reveals crawl problems. For example, you might see that critical pages are hardly visited, a sign that your linking and site structure aren’t helping them. You also get a detailed view of error codes-404s, server errors, and more-so you can tackle the worst noise first. The orphan page feature is the gem. The app checks the site crawl list against the log file and spots URLs that Google has found but that have no internal links. As a result, those orphan pages get inclusion links and finally gain value.
Pro Tip
After a full crawl with Screaming Frog, export the internal HTML URL list. Load it into a new Log File Analyser project for the same domain. Next, select the “Not in Log File” filter. Instantly, you’ll see which pages are in your crawl but never hit by a search bot. Consequently, this list flags pages that probably need more internal links.
Pricing Tier
Freemium model: Free for up to 1,000 log events. Buy a license for more.
Schema Markup Validator (plus Rich Results Test)
What It Is
The official Google tool to audit your structured data and confirm that the code is correct so the page can display as a rich result in search.
Why We Use It
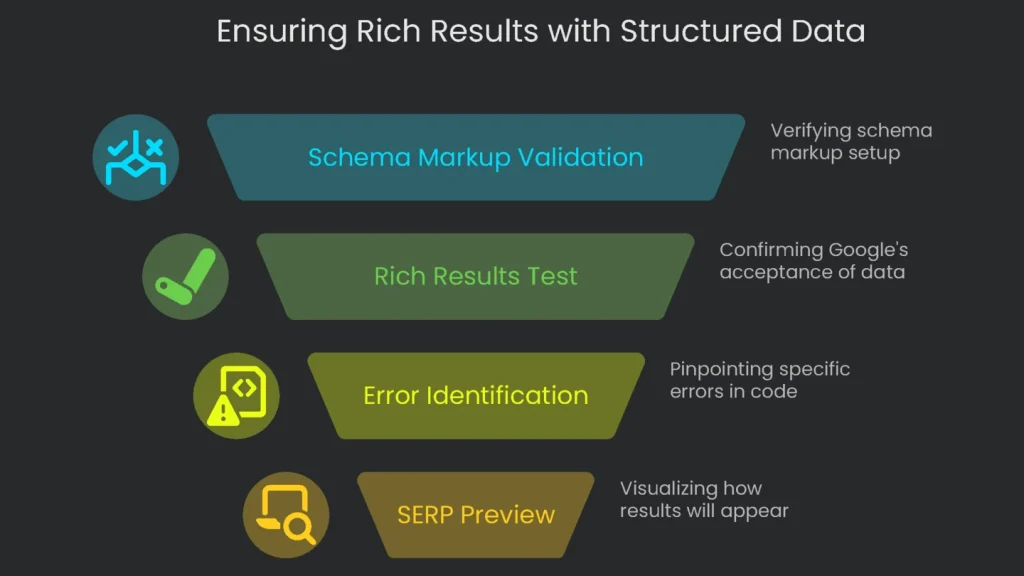
Schema markup is special code that tells search engines what’s on a page. This extra data can unlock rich results, like star ratings and prices, in the search results. The Schema Markup Validator checks the setup, and the Rich Results Test is the final confirmation that Google accepts the structured data according to its guidelines.
The big win is checking a webpage before anyone else sees it. Drop a URL or code into the box, and SEOs see if the structured data is ready for that shiny rich result and if blockers exist. Fix issues before the site goes live and it’s far easier to resolve. The tool doesn’t just say there’s an error; it points to the exact spot and names the field you need to add. For example, “Missing field ‘name’-go add that right now.” Another handy tool in the same box is the SERP preview. Click to see a mock-up of how that rich result should look in search, so you avoid surprises the next day.
Pro Tip
Make life easier: grab the JSON-LD code straight from the site’s source, paste it into the “Code” tab of the Rich Results Test, and test it on the fly. You fix the schema data while skipping the rest of the page. Devs love this trick because it shrinks the time to get things ship-ready.
Cost
Free for everyone.
Chrome DevTools
What It Is
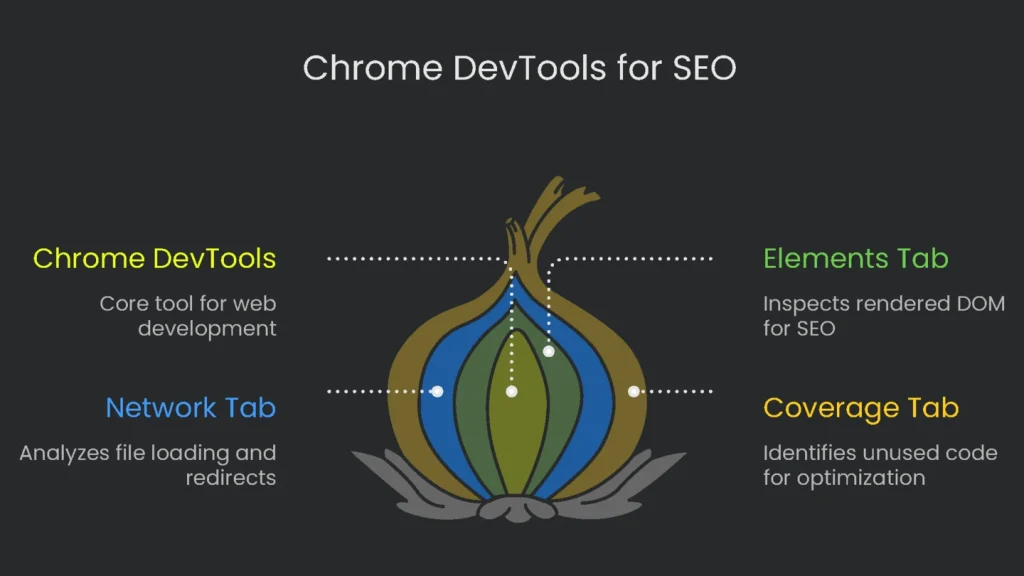
A toolbox already inside the Chrome browser. It gives you live previews and lets you tweak the page on the spot, so you see what’s broken before you finish scrolling.
Why We Use It
When you work on technical SEO, Chrome DevTools is your go-to buddy for quick, live checks. A common task is to peek at the rendered DOM, which is the page’s final HTML after JavaScript runs. Head to the ‘Elements’ tab to see what Google would actually read. This is crucial for JavaScript-heavy sites to ensure key content and links aren’t hidden when the robots arrive.
The ‘Network’ tab is like a live waterfall chart on steroids. It shows status codes for all files, helps you find oversized images dragging speed, and spots redirect chains for a single URL in a snap. Plus, the built-in device toolbar checks mobile-friendliness. This matters because Google is all about mobile-first indexing these days.
Pro Tip
Check the ‘Coverage’ tab to hunt down unused CSS and JavaScript. Open DevTools, switch to Coverage, then reload. As the page loads, the tool records which code gets used. In the end, you’ll see a report listing files with unused code, so you can tidy that up and speed up your page load time.
Pricing Tier
Totally free-no hidden costs, and it comes with Chrome.
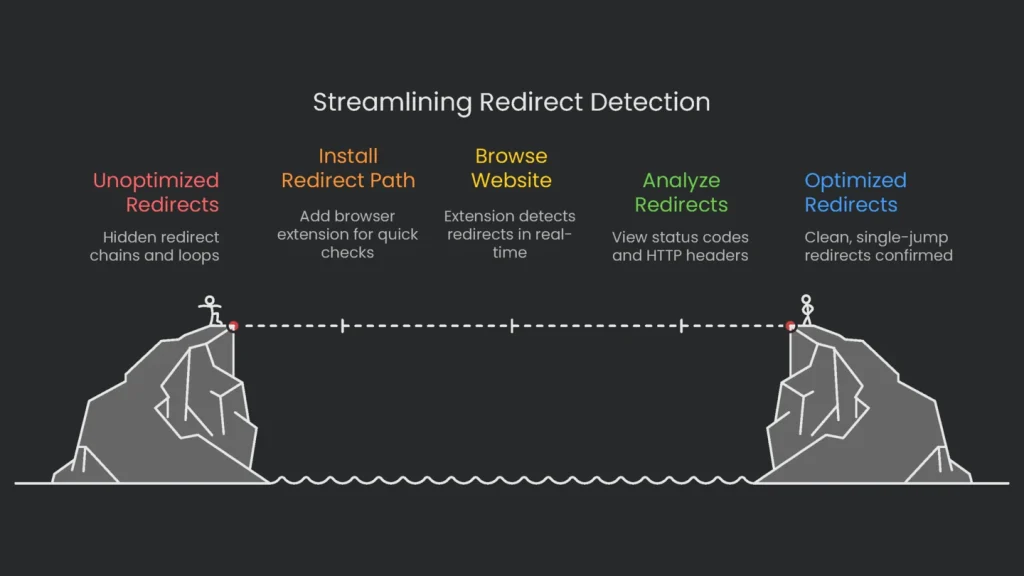
Redirect Path
What It Is
A quick browser add-on that shows all the HTTP redirects and status code details as you zip around a website.
Why We Use It
Redirect Path is built for speed, and that’s why we love it. When one page sends you to another and that one sends you to a third, that’s a redirect chain. This extension is our shortcut to spotting those loops. While you browse a site, the tiny icon in the URL bar lights up with the page’s final status code. Click it to unfold the entire travel itinerary-from the first link to the last hop-so you can tackle loops or long chains before they become a headache in an SEO audit or right after a site swap.
Even handoffs that sneak in client-side redirects (like Meta Refresh and JavaScript) show up. Server-side audits sometimes skip these, yet they can trip up search engines and crumble indexing. Consequently, detection here is critical. Beyond that, you’ll peek at useful HTTP headers like the server type and caching rules, all in a scroll that takes seconds.
Pro Tip
Combine the big-picture crawl with a human check. After a site migration, load Screaming Frog in “List Mode” with old URLs, crawl them, and confirm they all say 301. Next, take a random sample of 20-30 from that list. Open each in your browser, using Redirect Path, to see the redirect live. Therefore, you confirm not only that the redirect exists but also that it’s a clean, single jump with no loops.
Pricing Tier
Free.
Google Analytics 4
What It Is
Google’s analytics tool tracks web and mobile traffic using a flexible, event-based model to log page visits and user actions.
Why We Use It
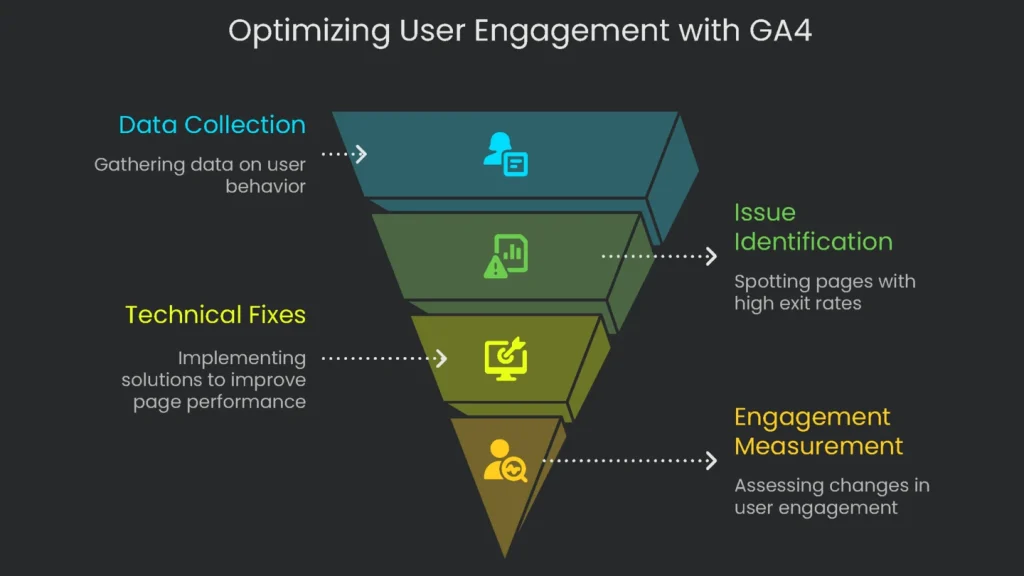
While the other tools spot and repair issues, GA4 measures the final score. It links technical fixes back to business results in dollars and cents. After a project that speeds up page load, GA4 can measure whether average engagement time or the conversion rate rose. Without this data, a good-looking site isn’t budget-approved on the inside. This report proves the project was worth the time and budget.
GA4’s event-driven setup watches what users actually do instead of just counting page loads. You can log actions like scrolling, clicking key links, and sending a filled-out form. Consequently, you can spot trouble-like a page that takes too long to reply-before people abandon their cart.
Make sure to link the site search console back to GA4. When you do, you’ll see which searches land users on which pages (that’s the GSC side) and what they do next after clicking in (that’s GA4’s job). Together, they show which high-traffic pages with high exits deserve first dibs on technical repairs.
Pro Tip
Customize reports the easy way with a “Funnel exploration.” Track the effect of a technical fix in real numbers. For instance, speed up a checkout that drags through three steps. Set up a funnel with those steps as stages, measure the drop-off rate before, then measure again after. Consequently, you’ll have a snapshot that shows the fix turned more visitors into customers and ticked up revenue.
Pricing Tier
The basic version is free, and there’s a paid tier-Analytics 360-for enterprises that need more power.
Wrapping Up
Key Takeaway
To really rock technical SEO, you must spot, fix, and check a site’s problems like a doctor taking your pulse. The tools here aren’t pixie dust; they’re high-tech gadgets for pros. When a veteran applies each one, it’s like a musical score lifting off the page. Search Console rings the doorbell first, Screaming Frog sketches the blueprint, a log-file reader flips the site’s secrets to page one, tools like PageSpeed Insights and GTmetrix raise speed through the scientific method, and GA4 counts how much faster you just made a visitor’s smile.
Call to Action
Too swamped to hit the learning curve? Finally, let the squad at Technicalseoservice strap the tools to your rocket boosters and launch your site’s speed and health for you.
Implementation steps
- Jot down necessary routines (site crawl, log checks, user stats, data clean) and must-have capabilities.
- Pilot 2 to 3 tools for each routine, sizing them on accuracy, reach, and API compatibility.
- Map your data journey (storage & charts) to align views across tools.
- Bargain for licenses and onboard the team using standard playbooks.
- Review returns on tools every 6 to 12 months and replace the weak links
Frequently Asked Questions
Do I go all-in on one tool?
Nope—mix a crawler, log house, performance monitor, and one to check theory in the wild.
What crawler ladder up my page counts?
Screaming Frog or a sibling; size, budget, and wish-list features should steer the choice.
How to select any gizmo?
First check how spot-on the data is, if it has open APIs, and how well it runs on autopilot.
Should I go freemium first or card-swipe upfront?
Taste a mix for now, start low or no, and hit upgrade only when data piles up.
How to put a price on all this?
Link hour savings and glitches scrub with using the tool, then show the clock giveaway in dollars.