LCP, CLS, and INP are the signals that matter. Know how they are calculated, where to access real user data, and what fixes move scores the quickest.
Picture this: you type in your question, click the first link, and freeze on a blank screen. You wish the Wi-Fi would just work. Worse, the page suddenly repositions, and you accidentally subscribe to email spam. Yuck! Google saw that face and thought, “We can do better.”
The Page Experience Update
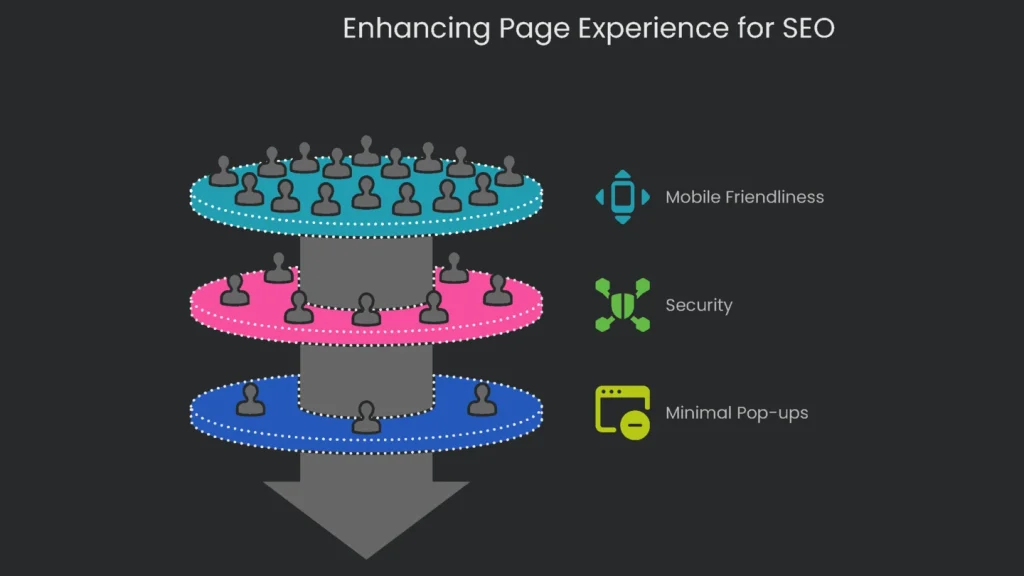
Once, Google just linked the right words to the right question. Now, the right words and the right page experience walk in together, arm in arm. Therefore, enter the Page Experience Update-a smart set of friendship rules your page must follow to stay popular. In short, good vibes are not just for “neat tech” fans.
What It Checks
It inspects:
- Is your page friendly to my smartphone-fiddling friend?
- Does it load on a safe, sunny highway (ultra-secure HTTPS)?
- Are dancing pop-ups kept to a minimum?
Why It Matters
As a result, search can reward pages that feel fast, safe, and calm. Consequently, experience signals now back up strong content rather than sitting on the sidelines.
Core Web Vitals
Overview
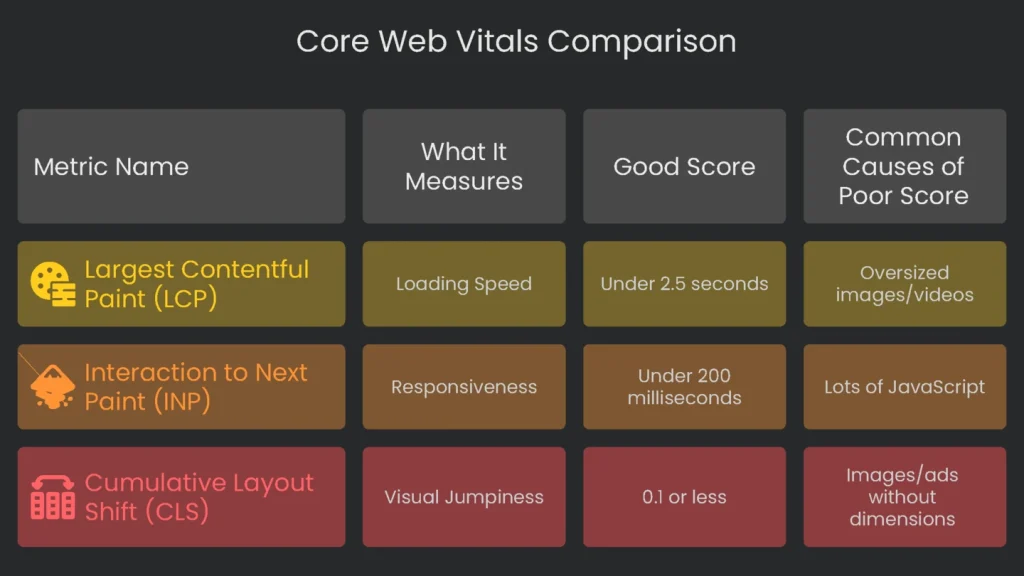
Buried inside the friendship rules are the Core Web Vitals. They measure three types of page love: Does the banner settle peacefully (LCP)? Does the page react quickly (INP)? And does the layout stay still (CLS)? Yes, Core Web Vitals are now part of the report card. Therefore, Google really counts them.
This is not the usual tweak. Previously, “good user experience” felt subjective, shaped by pretty layouts and snazzy tricks. Now, Core Web Vitals turn that into hard numbers we can measure and improve. Consequently, technical work has become front-line customer service and marketing. It influences both search visibility and business results. For example, here are the three stats we will dig into.
| Metric Name | What It Measures | Good Score |
| Largest Contentful Paint (LCP) | Loading Speed | Under 2.5 seconds |
| Interaction to Next Paint (INP) | Responsiveness | Under 200 milliseconds |
| Cumulative Layout Shift (CLS) | Visual Jumpiness | 0.1 or less |
The Core Web Vitals have three parts. Think of them as three legs of a stool that keep your website steady. If one leg is too short or shaky, the whole seat sways, and people notice.
Largest Contentful Paint (LCP): Loading
What It Measures: Largest Contentful Paint (LCP) tracks the time it takes for the biggest piece of content-a hero image, a headline, or a video poster-to fully appear. In short, think of LCP as “what the user sees first.” It does not time the entire page or every script. Instead, it marks the moment when the visitor feels the page is ready and useful. A good LCP is under 2.5 seconds. Between 2.5 and 4.0 seconds “Needs Improvement,” and more than 4.0 seconds is “Poor.”
The usual suspect is a slow server. However, other common causes include:
- Oversized Images and Videos: Huge files download slowly and can stall the entire page.
- Blocking JavaScript and CSS: Some files force the browser to pause rendering until they finish.
Interaction to Next Paint (INP): Responsiveness
What it Measures: INP is like a stopwatch for your site. It times the gap from a click, tap, or keypress to the next visual update. Therefore, it captures the pause a user actually feels. A good score is under 200 milliseconds. Scores between 200 and 500 milliseconds need improvement. Anything over 500 milliseconds is poor.
What Makes INP Score Drop?
- Lots of JavaScript: Heavy scripts can prevent the browser from noticing input fast enough.
- Long Tasks: Code that runs longer than 50 milliseconds blocks the main thread.
- Third-Party Code: Ads, tracking scripts, and social buttons often slow everything down.
One important detail: INP replaced First Input Delay (FID) in March 2024. FID only counted the first click. However, INP watches the longest delay during the entire visit, which better reflects real user experience.
Cumulative Layout Shift (CLS): Stability
What it Measures: Cumulative Layout Shift (CLS) checks how much elements move while a page loads, without any user input. For example, you might read a post as the text keeps sliding, or you try to click a button that jumps when an ad loads. A low CLS means the page is stable and predictable.
What’s a Good Score?: CLS is a number, not a timer, and lower is better. A score of 0.1 or lower is “Good.” From 0.1 to 0.25 it “Needs Improvement,” and anything above 0.25 is “Poor.”
Common Causes of a Poor Score:
- Images, ads, or videos without defined dimensions: If height and width are missing, the browser guesses and the layout shifts when the asset arrives.
- Content That Loads On The Fly: Cookie notices or pop-ups can push content if you do not reserve space.
- Font Files Arriving Late: Text may render in a fallback font and then jump when the brand font loads. This is a Flash of Unstyled Text (FOUT).
Checking How Your Site Performs
Quick Start
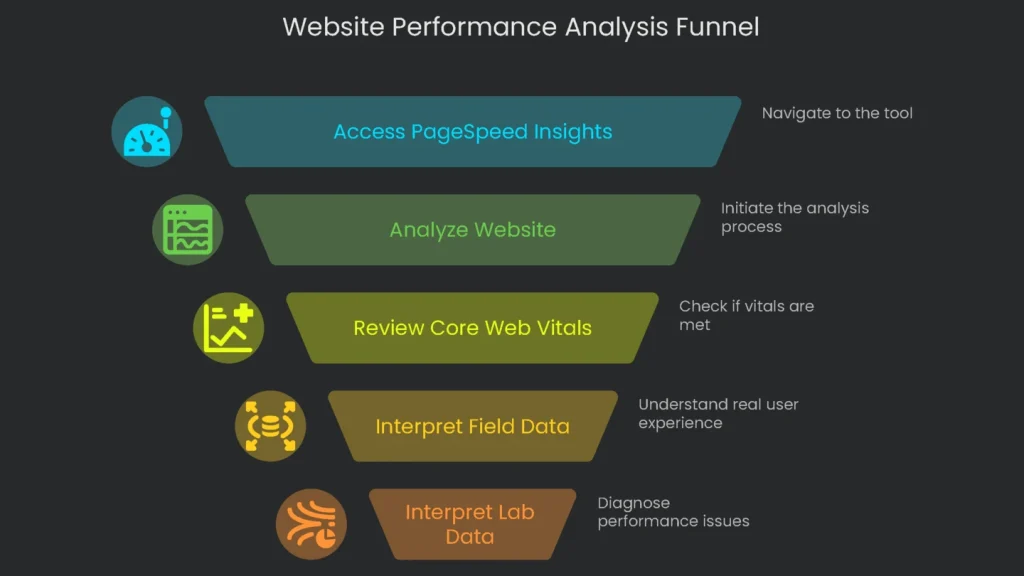
Luckily, Google has a free tool to help. Non-techies should head to pagespeed.web.dev. Next, follow these simple steps.
- Head to the PageSpeed Insights tool.
- Paste the full web address of the page you want to check.
- Start with the homepage, then test a popular product page or a share-worthy blog post.
- Hit “Analyze,” and give it a moment to gather data.
Understand Your Results
At the top of the report, you will see whether your page passed the Core Web Vitals test. Consequently, this final score reflects how regular visitors experience the page.
Field Data and Lab Data
To make sense of the score, know the two kinds of data in the report.
Field Data (“See what visitors really experience”): This is the section to prioritize. It shows performance from live Chrome users over the past 28 days. Because it covers many devices and networks, it is how Google ranks you.
Lab Data (“Diagnose performance issues”): This is a controlled test on an average phone with a slow connection. Developers love it for finding bottlenecks. However, it does not reflect all users. When Field and Lab disagree, let Field Data lead.
Core Web Vitals and Your Bottom Line
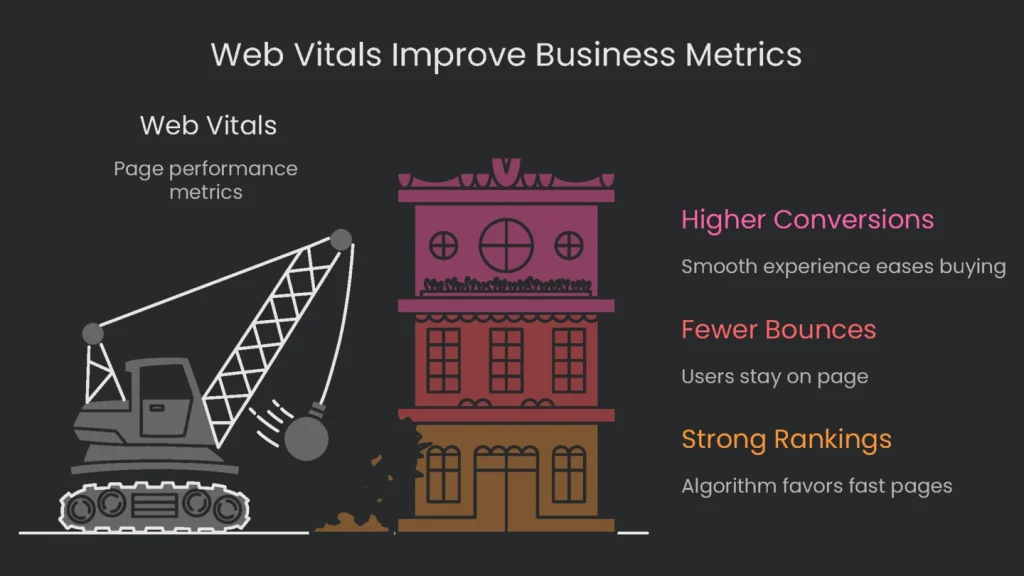
Better Web Vitals equal better business. Consequently, improvements here can lift rankings and revenue.
Strong Rankings
Core Web Vitals are part of the algorithm. Therefore, if your page edges out the competition, it can outrank similar pages in results.
Fewer Bounces
When a page loads quickly and stays stable, more people stick around. Google studies found that meeting the Core Web Vitals benchmarks makes users 24 percent less likely to leave before loading finishes. For more, visit web.dev/case-studies/vitals-business-impact.
Higher Conversion Rates
A quick, smooth, and steady experience makes buying easier.
- When Vodafone cut its LCP by 31%, sales rose by 8%.
- Data from NitroPack shows shaving 0.1 seconds off load time can lift retail conversion by 8.4%.
- An Akamai survey found a 100-millisecond lag can shrink conversion by 7%.
These small glitches are revenue-killing roadblocks. Consequently, fixing Core Web Vitals is not polish; it removes friction between a curious visitor and a paying customer.
Make Your Numbers Pay
Read the Report Like a Map
Grab that Core Web Vitals report and read it like a treasure map. The real treasure comes later, when the map leads to user joy and extra cash. If the PageSpeed report says “Fails,” or the bars glow red and orange, your checkout page may be emptying faster than a leaky bucket.
How We Help
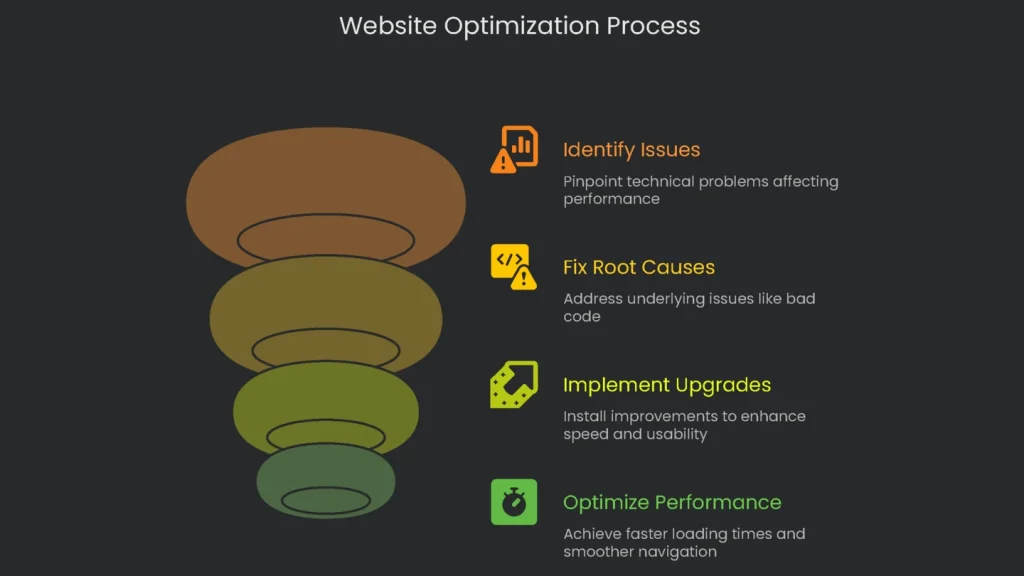
Our crew of SEO techies and UX pros at Technicalseoservice lives in this data. We dig until we hit the cactus-bad code, bloated images, and lazy scripts. Then we fix root issues and install upgrades that speed things up and smooth out bumps. As a result, visitors flash payment cards, not error messages. Finally, drop us a line, and we will set you up with a Core Web Vitals Optimization plan that pays for itself. Let’s team up to turn your website into a secret weapon for growth!
Implementation steps
- Open your CWV report in Search Console so benchmark data is waiting from day one, and you test in the real world.
- Spot the slowest pages by their LCP, INP, and CLS scores, and list the templates behind those pages.
- Assign responsible teams to fix images, script bloat, or layout issues based on the relevant metric.
- Pin new changes behind feature flags; confirm you see real-world performance for every adjustment you make.
- Add Core Web Vitals tests to your CI runs so regressions can’t make their way into the production code
Frequently Asked Questions
Which metrics are the key ones now?
Focus on LCP (loading), INP (interactivity), and CLS (visual stability).
What are the acceptable limits?
LCP should be ≤2.5s, INP ≤200ms, and CLS <0.1 for a good user experience.
Where do I find my metrics?
GSC CWV report and the field section of PSI (CrUX).
Do CWV scores influence my page rank?
Yes, but they are only one of many signals; a good experience boosts rank and revenue.
So you want to boost your site’s performance?
Start by finding the sneaky culprits slowing you down. Check images first. Make them smaller without killing the quality, and switch to formats like WebP for even better results. Next, tackle code bloat. Eliminate the JavaScript and CSS you don’t need. Minify and compress the rest, and load only the code that’s absolutely essential for the page the user first sees. Last, fix those pesky layout shifts. Apply the sizes for images and ads right in the HTML, so the page doesn’t jump around when things load. By zapping these three trouble spots, you’ll hand your visitors a fast and silky experience.