
We have made technical SEO predictable and repeatable through Discovery, diagnostic crawl, deep audit, prioritized roadmap, implementation support, QA, and measurement.
Speed fuels your profits today as never before. When a website drags, it isn’t a small irritation. It’s an open leak on your cash register, a turn-off to customers, and a brick wall hiding your growth. Consequently, our analysis shows that a single second on the mobile timer can ruin 20% of your sales. Moreover, a one-second wait shrinks sales by a quick 7%. As a result, cutting the wait to one second can triple sales compared to a page that creeps to five seconds. The numbers speak for themselves. Therefore, a store raking in 100,000 each day clears 36.5 million in a year, and a single sticky second can steal $2.5 million of it.
Why Technical SEO is important?
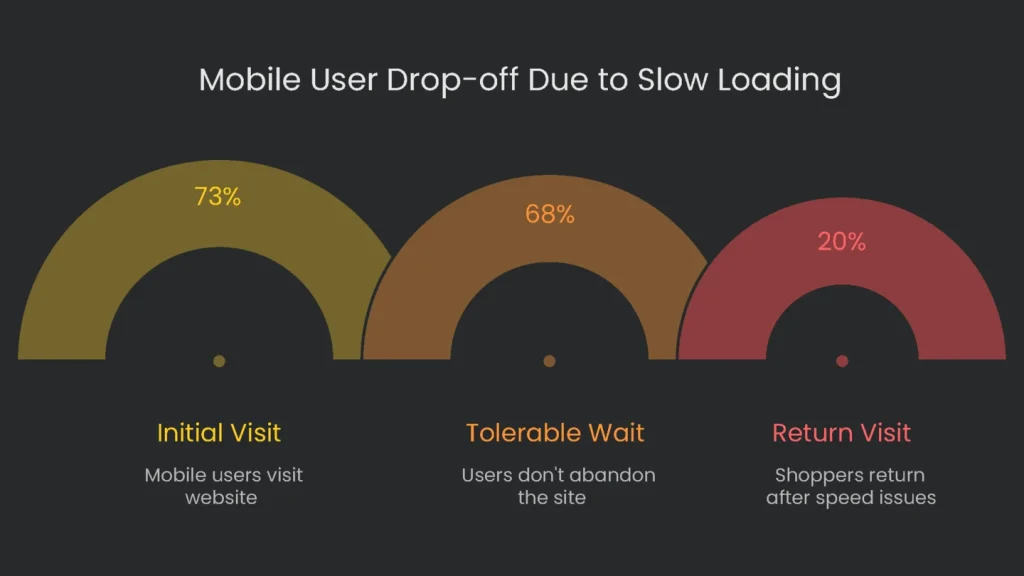
However, when a website is too slow, customers walk away. Research reveals that over half of mobile users abandon a site that takes more than three seconds to show up. We call this quick exit the “bounce rate,” and it keeps climbing the longer they wait. For example, going from one to three seconds spikes the chance of bouncing by 32%. If we stretch that wait to ten seconds, the risk skyrockets by 123%. Even worse, the harm isn’t just a single missed sale. As a result, slowly loading screens chip away at brand trust, and that trust is hard to rebuild. Numbers show about 80% of shoppers bothered by speed problems won’t come back, and one extra second of wait time drops overall satisfaction by 16%.
Top businesses back up the numbers. For example, a report from Deloitte found that speeding up a site by just 0.1 seconds raised online sales by more than 8% and pushed customers to spend nearly 10% more per visit. Additionally, Walmart discovered conversions climbed by 2% with every one-second speed gain, and Vodafone counted an 8% sales bump once it sped up its website.
Many companies miss a crucial step: watching the customer’s path from one screen to the next. Right now, mobile is the boss of web traffic—certain industries report that 73% or more of visitors come from phones. However, those phones take their sweet time. Average mobile loading is slower than the desktop, and that’s a bottleneck. Meanwhile, 69% of people check out big-ticket items on mobile but wait to purchase on a desktop. Therefore, a sluggish mobile first impression tarnishes the entire brand. If your site lags the first time someone lands on the mobile page, many won’t wait. They close the tab, forget the mental bookmark, and are less likely to try again later. In short, you don’t just lose mobile orders; the injury ripples and may rob the desktop of its future payday, too.
Load Times and What They Mean
Speed Benchmarks at a Glance
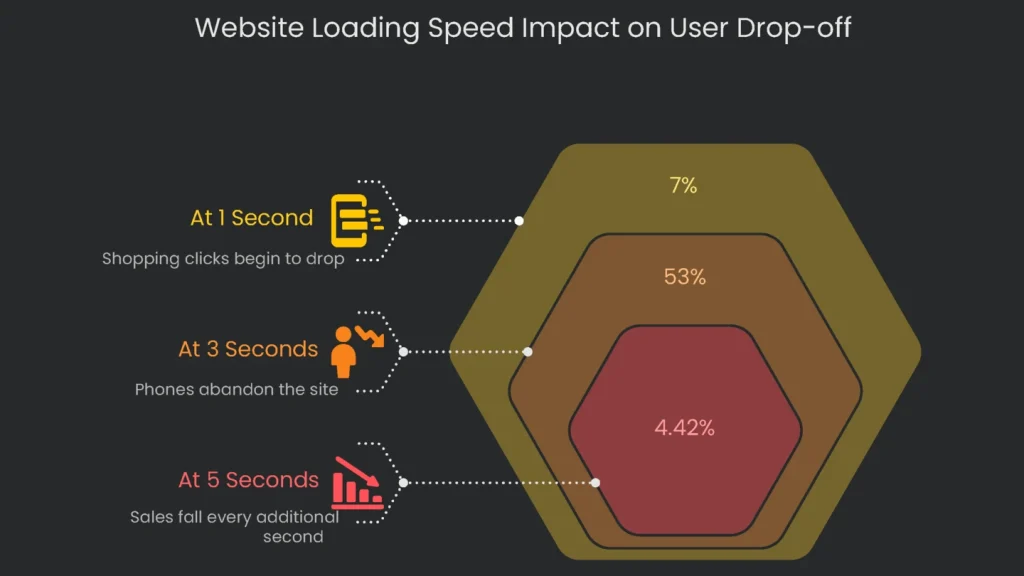
When a site takes longer to load than we think it should, here’s what might happen:
- At 1 second: We could see a drop in shopping clicks by 7%. For most phones, only 7% will leave. However, one second still makes users 16% less happy when they see the spinner.
- At 3 seconds: Losses rise to 20% because 32% more users see the loading fail and leave. Consequently, 53% of all phones abandon the site for good.
- By 5 seconds: The drop gets steeper—sales fall by 4.42% for every additional second that rolls by. As a result, five seconds also makes phones 90% more likely to leave.
- At 10 seconds: Finally, the likelihood of a mobile user leaving jumps to 123%.
- At Checkout: 79% of shoppers in the very last checkout step say they won’t return if they experience issues.
Next, hold that thought while we check out how Google watches all this.
Google’s Core Web Vitals
To stop slow web pages from hurting every online store, Google rolled out a playbook called Core Web Vitals. They aren’t tips and tricks. The second you fall short, you already dropped in the search lineup. Since 2021, they’ve counted as a ranking headline. If a site scores all three, it’s like getting a “great condition” sticker. The sticker doesn’t shout; however, it whispers “choose me” on search results, pushing it ahead of pages that sell the same laser printer but load like molasses. Consequently, Core Web Vitals give every store an objective scoreboard to spot real loading problems and how users feel before they hit the buy button.
However, the latest data shows that even well-known sites stumble on key performance benchmarks, and the experience lags the moment a visitor clicks. Solving the Core Web Vitals problem is more than a dev-team to-do. Designers and marketers must join the mission of speed. That shift creates a “performance-first culture” where even a tiny mobile arrow is debated for seconds saved. In short, a disappointing report signals silos, not just slow code. Fixing the numbers takes technical skill and culture change. As a result, the payoff is confidence—for users ready to engage and for search engines eager to reward maturity and respect for customers.
Largest Contentful Paint (LCP): First Impression
- What it is: LCP ticks a stopwatch from the click to when the biggest on-screen element—often a photo, hero heading, or video—finishes loading. Therefore, it acts like the site’s handshake: “You’re in the right place.”
- Why it matters: A brisk LCP soothes the user and dodges the dreaded back-button tap. Google casts a favorable LCP at 2.5 seconds, the sweet spot before impatience turns into tab swapping.
Interaction to Next Paint (INP): Responsiveness
- What it is: Interaction to Next Paint (INP) shows how fast your site reacts to any click, tap, or keypress. It replaced First Input Delay (FID) in March 2024, giving a clearer view of responsiveness across the whole visit.
- Why it matters: A quick INP—under 200 milliseconds—makes the page feel smooth. Consequently, people feel in control and complete tasks, like buying an item.
Cumulative Layout Shift (CLS): Visual Stability
- What it is: Cumulative Layout Shift (CLS) tracks how much content jumps while the page loads. For example, when a heading or button moves, the score rises. Keeping a low CLS—meaning things stay put—helps visitors click without surprise.
- Putting user trust front and center: When your website’s cumulative layout shift (CLS) score is low, people see a polished, professional site they can trust. High CLS, however, can lead to painful misclicks that quietly chip away at brand reputation. Since CLS is worth a hefty quarter of your Lighthouse score, the number can light up or dim your overall badge. Therefore, aim for a CLS of 0.1 or lower.
Our Strategy
In short, top-notch website speed is not a do-it-and-done checklist. It’s a synchronized dance between the server, the browser, and the mobile screen. However, a hiccup at one end can erase gains at the other—lightning-fast 5G can’t buffer a sluggish server. Consequently, our roadmap finds and fixes bottlenecks across servers, scripts, and storage to keep every click snappy.
Asset and Image Optimization
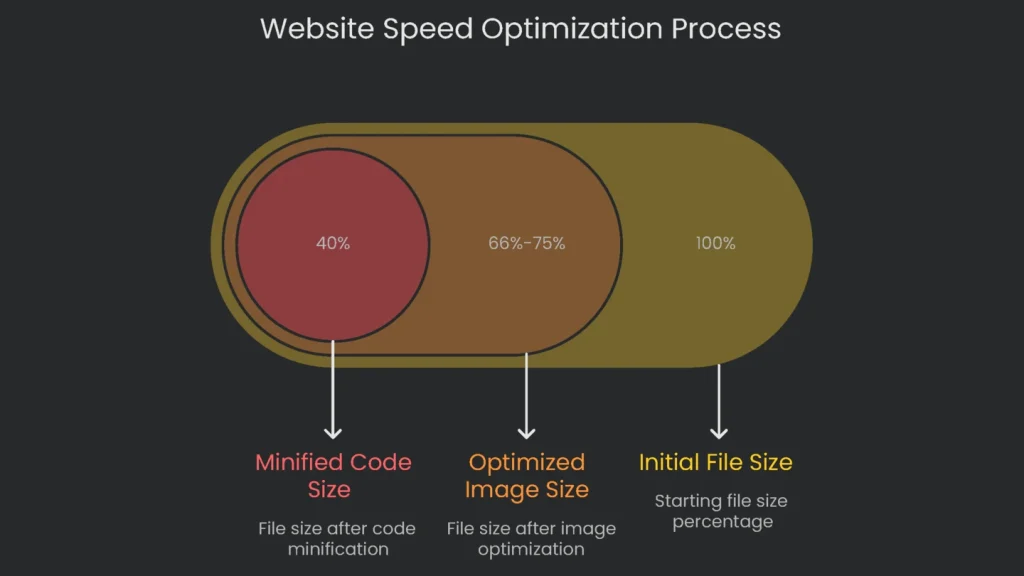
Asset and image optimization kicks off with a careful review of every photo and graphic on the site. Because images are usually the heaviest files on a page, they’re a big reason the Largest Contentful Paint (LCP) timer drags. To fix this, we convert eligible images to WebP or AVIF; they trim file sizes by 25–34% compared to classic JPEGs without losing clarity. Next, we enable lazy loading so pictures only load when they’re about to roll into view. To wrap up, we declare width and height for every image and video so the browser reserves space and keeps the layout locked. Consequently, these steps deliver a snappier LCP, tighter CLS, and less pressure on data plans.
Code and Script Minification
Most sites pack HTML, CSS, and JavaScript with helpful bits no computer needs. There are comments, blank spaces, and overly long variable names. We call that “code bloat.” Therefore, when we trim it through minification, files can shrink by up to sixty percent. Consequently, the browser parses faster, LCP improves, and interaction delays (INP) stay low.
Caching and Content Delivery Networks (CDNs)
To deliver content snappily, we use two steps. First, browser caching stores repeat files locally so they load instantly on return visits. Second, a premium Content Delivery Network (CDN) serves content from the closest edge location. As a result, server response times drop and LCP improves worldwide.
Streamlining the Critical Rendering Path
The Critical Rendering Path is the series of steps a browser takes to convert code into pixels. Therefore, we inline the core CSS needed for the first viewport and defer the rest. Consequently, the primary view arrives sooner, LCP drops, and the pauses that trigger tab switching fade away.
Burning TTFB Miles
Almost every speed tip starts with a speedy server. The number to watch is time to first byte (TTFB). Basically, it measures how long the browser waits after you hit “Go.” Therefore, we run full server diagnostics, fix slow queries, upgrade weak hosting, or patch code bottlenecks. Our benchmark is to push TTFB below 800 milliseconds. Consequently, every other metric, including LCP, benefits.
Your Speeding Edge
Why It Pays Off
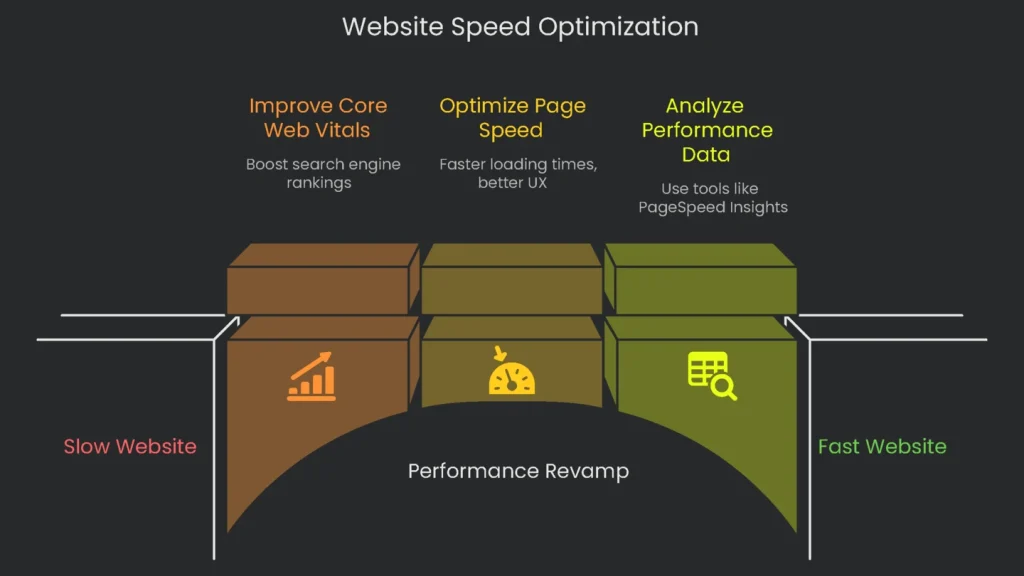
Fixing speed and improving Core Web Vitals is not a bill on the floor; it’s the sharpest investment on your P&L. The tab for letting the website crawl—slow buys, low-star reviews, and sliding search results—is more costly than a full-speed revamp. Consequently, speed fixes pay for themselves, shaking loose lost customers, padding lifetime value, and signaling quality to search engines. In short, boost from a crawl to a sprint and unlock the growth your website is hungry for.
Business Benefits
Our full performance plan pays off right away, and it boosts your profits in these ways:
- Better Search Position: When your site nails Core Web Vitals, it climbs search lists. Consequently, more free traffic arrives.
- More Sales, More Money: Speedy pages let customers move quickly, so they buy faster, fill out more forms, and often spend more per order.
- Deeper User Engagement: When your site responds instantly, visitors stick around, view more pages, and dive deeper into your content.
- Smaller Bounce Rate: A fast site keeps customers on the path to buy, so they stay and don’t rush off to a competitor.
- Better Brand Image: A site that loads fast and looks sharp earns trust and loyalty. Therefore, it proves you value customers’ time and stand for quality.
Finally, turn speed into extra income—This week, optimize your site!
Implementation steps
- Launch by setting objectives, key performance indicators, data access, and timelines.
- Crawl, check log files, and explore analytics to spot problems and chances.
- Rank fixes by impact, effort, and risk; assign tasks to owners on a clear timeline.
- Guide release, quality check, performance in pre-prod, then in production.
- Summarize changes, then refresh the backlog every three months
Frequently Asked Questions
What are the phases?
Map and scope, crawl and audit, prioritize, build the roadmap, nail the rollout, check, then measure.
How do you prioritize tasks?
Impact next to effort, next to risk, all three tethered to the quarterly goals.
What tools do you use?
We load crawlers, sift through log analyzers, measure with PageSpeed or Lighthouse, and cross-check on GSC.
What access do you need?
CMS, analytics, GSC, and sometimes the raw logs or the guts of the hosting server.
How do you report progress?
Frequent updates that touch the KPIs, then the page experience scores, then the downstream revenue indicators.