
Interaction to Next Paint (INP) is the measure of how responsive is a webpage. We helps you to breakdown and distribute long complex tasks, defer non critical JS, streamline the DOM and instant response for certain inputs.
When it comes to web performance, giving visitors a great experience is the top priority. Starting March 2024, Google officially shifts to Interaction to Next Paint (INP) as the key measurable for how quickly a site reacts to a visitor’s action, replacing the previous First Input Delay (FID). As a result, responsiveness now has a single, clear focus. Therefore, businesses, webmasters, and developers need to get comfortable with INP because it affects how smoothly a site runs and where it lands in search results.
What is INP?
Interaction to Next Paint (INP) shows how quickly a web page reacts to a visitor’s command. It keeps tabs on the delays after every click, tap, or keypress made while the page stays open. INP ignores any metrics for scrolling or simply hovering the pointer. Unlike FID, which grabs a single snapshot, INP measures every possible interaction from the time a page starts to load until visitors leave. In short, Google uses the worst delay as the final “grade.” Consequently, the lower that delay, the sweeter the visitor experience.
Why INP Took Over for FID
Dropping FID for INP shows we get how people really use the web now. FID only watched how long the first tap or click waited before the phone finally reacted. However, it tested only the first moment the page loaded.
That tiny snapshot missed everything people do the rest of the time. It could look like the page was fast even when it really wasn’t. Chrome’s stats say most people spend almost the whole time on the page after it pops up, not loading it.
A high FID meant the page looked good based only on that first tap, forgetting what happened the moment someone tried to scroll, type, or add to their cart. The rest of the time was ignored, and that’s when a page felt slow even if the loading spinner was long gone. Therefore, INP upgrades the story.
Now we measure how every action felt, not only the first click. Instead of a single moment, the number tracks everything that happened after a tap, swipe, or key. From the moment the phone recorded the input to when the new image, button color, or animation shows on the screen, INP follows every tiny delay. As a result, this full-cycle method matches what real users feel. Because of it, developers must ensure pages stay responsive for every moment a visitor is on them.
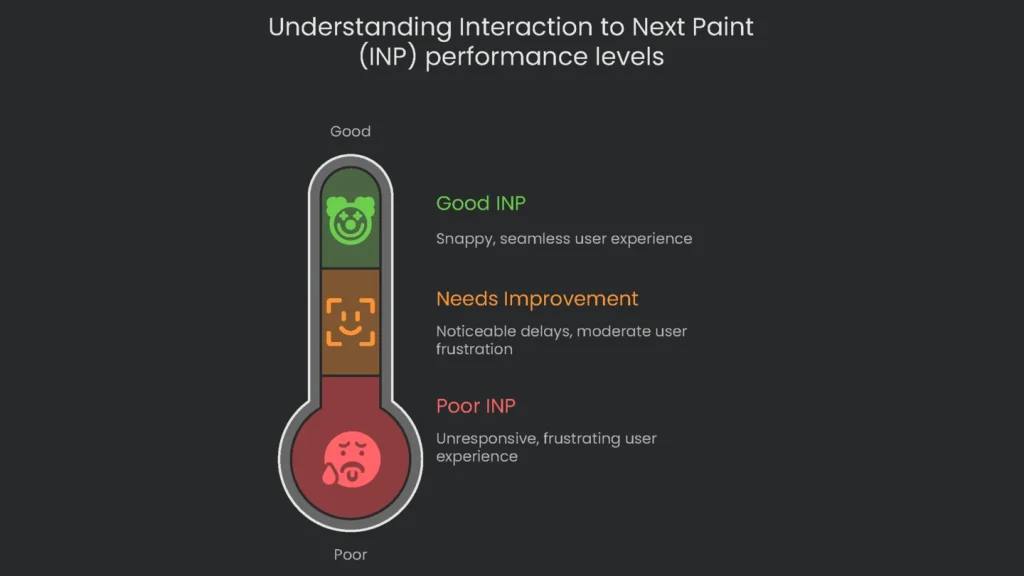
What’s a Solid INP Result?
To keep users happy, Google spells out what counts as a healthy INP, tracked in milliseconds.
- Good: The INP is 200ms or under.
- Needs Improvement: The INP lands between 200ms and 500ms.
- Poor: The INP goes beyond 500ms.
To nail the Core Web Vitals check, at least 75% of your page views need to hit the “Good” INP mark. So, for every four site visitors, the longest delay they feel when they click, tap, or type should be 200ms or shorter.
| Feature | First Input Delay (FID) | Interaction to Next Paint (INP) |
| Metric Focus | How the web feels on first contact | How the web feels on the whole journey, not just the first hop |
| Interactions Measured | Only the taps, swipes, or clicks that come first | Every action—clicks, swipes, taps, key presses—in the journey |
| Latency Measured | Only the lag before anything runs across the web | Full lag: that input lag, then any processing, then the wait to show the result |
| Primary Cause of Poor Score | Too much coding or layout getting in the way when the page loads | Heavy blocks of JavaScript that run at any moment after that, crowding the main thread |
The Three Phases of an Interaction
If you want to boost the low INP number, remember that every click, tap, or key press goes through three phases. Any of these phases can slow the whole journey for real people. Therefore, focus on the entire sequence, not just the first instant.
Input Delay, Processing, & Presentation
Every user action lights up a sequence that the engine runs. INP stitches together the total time, turning the user action into something visible. When you sum these phases, you add input lag, the time the engine needs, and the final wait before pixels actually update. Next, let’s look at the first phase.
Phase 1: Input Delay
- Definition: Input Delay is the clock tick that runs after you touch, tap, or click, but before JavaScript recognizes you have.
- Cause: Long input delays start when the main thread—the browser’s busiest worker thread—can’t juggle new requests. If it is stuck running a giant JavaScript file, a click or tap must line up behind it until the file finishes. This problem is common right when a web page is loading and JavaScript is warming up to do its job.
Phase 2: Processing Time
- Definition: Processing Time is the clock time based on when your event handler finishes running the JavaScript that reacts to a user tap or click. In this stage your app logic takes its shot to decide what to do next.
- Cause: When processing takes too long, it usually boils down to heavy or clumsy JavaScript running too much logic. This could mean ballerina-caliber math or dozens of DOM element changes in the same frame. Consequently, this part often makes a page look sluggish and is also the part we can clean up the most.
Phase 3: Presentation Delay
- Definition: Presentation Delay measures the time the browser takes to update the screen so the freshly finished application logic looks visually real to the user.
- Cause: Delay happens because of all the work the browser has to do to show results. It needs to recalculate font sizes, sit elements just right, and color every pixel on the screen. If the page has a huge DOM or a tangled structure, even a tiny style change feels like pushing through mud.
The Real Reason Your INP Is Lagging: Long Tasks
The three steps the browser follows do pile on time, but the biggest offender is the Processing Time, and that’s usually heavy JavaScript. JavaScript is single-threaded—it finishes one task before taking on the next. Therefore, a meaty onClick, resize, or input handler can hog the thread and pause every other action. This makes the current tap wait and delays the next tap as well. Consequently, debugging one sluggish JS event can polish the responsiveness of every other tap or swipe on the page.
How to Find and Measure INP That Isn’t Good Enough
To improve INP, it is best to blend live, real-user data with controlled lab number-crunching. Field data tells you what clicks, types, and swipes feel slow in the real world. Lab data, on the other hand, measures every millisecond and shines a light on the real culprit. Consequently, use both.
Using Field Data to Fix Performance Problems
Field data—often called Real User Monitoring (RUM)—is the most accurate way to see how your site’s INP performs. It tells you how real people see your pages on different devices and slow connections.
Start at Google Search Console
The first stop for checking INP issues is the Core Web Vitals report in Google Search Console. Open the “Core Web Vitals” section for your site. Next, scan for URLs marked “INP issue: longer than 200ms.” This report stacks similar URLs together so you can spot templates or page types that need help. The info is pulled from the Chrome User Experience Report (CrUX).
Dig Deeper with PageSpeed Insights
After you see a problem in GSC, PageSpeed Insights gives you the details you need. Copy a URL from the problem list in GSC, then paste it into PageSpeed Insights. The report will show the page’s INP number from the past 28 days of CrUX data. This confirms the problem and gives you a starting point for tracking improvements.
Get Detailed Insights with the Web-Vitals Library
If you need a closer look, sprinkle the web-vitals JavaScript library into your site. The attribution version collects focused info from your visitors, like which specific element (think button#submit-form) triggered the problematic INP score.
JavaScript
import {onINP} from 'web-vitals/attribution';

onINP(({name, value, rating, attribution}) => {

    const body = {

        metricName: name,

        value: value,

        rating: rating,

        targetElement: attribution.element,

        interactionType: attribution.eventType,

        loadState: attribution.loadState

    };

    // Send to your analytics endpoint

});
Using Controlled Data to Reproduce Issues
Once real-world data spotlights a sluggish interaction, you recreate it in a controlled “lab” setting. The go-to tool is the Performance panel in Chrome DevTools.
How to Use the Performance Panel
- Setup: Simulating the average user correctly is critical.
- Use a Guest Profile: Launch Chrome in an incognito window to block browser extensions.
- Enable Mobile Emulation: Most rough INP scores occur on mobile. Turn on device mode and choose a mid-tier device.
- Test Throttled CPU: Head to the Performance panel’s settings and slow the CPU to either 4x or 6x speed to mimic a weaker machine.
- Recording:
- Bring up the webpage with the sluggish operation.
- Hit the “Record” button in the Performance panel.
- Carry out the slow action being tested—like tapping a dropdown.
- Press “Stop” to finish the recording.
- Analyze: The performance profile gives you a mountain of details. Zero in on these spots:
- Check the “Interactions” Track: It lists every action a user takes. Your slow action will be flagged with a red triangle if it took more than 200ms. Hovering over the triangle splits the delay into Input Delay, Processing Time, and Presentation Delay.
- Look at the “Main” Track: Find a long task—gray with red stripes—matching the Processing Time of the slow action. That’s a big red flag.
- Inspect the Flame Chart and Summary Pane: Click on that long task. The “Summary” pane at the bottom reveals the breakdown. The flame chart above shows the JavaScript call sequence and helps you trace the delay to the offending code.
Use Lighthouse Timespan Mode
For quicker results, switch your Lighthouse panel to Timespan mode in DevTools. Just hit record, click around your page, and Lighthouse will produce a report that includes an Interaction to Next Paint (INP) score and targeted advice for that exact time. Finally, compare the timespan report to your RUM findings.
How to Fix a Slow INP
Found a sluggish interaction? Let’s speed it up. These strategies tackle the top reasons INP scores tank. Consequently, apply them where your data points first.
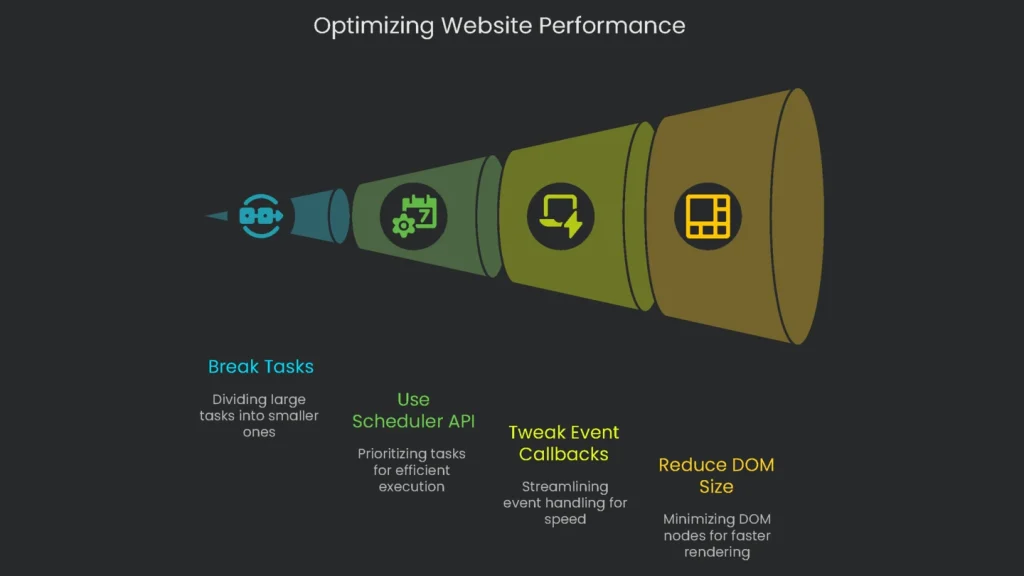
Chop Big Tasks Into Bite-Sized Pieces
JavaScript processes one task at a time. Tasks that stretch past 50 milliseconds become “long tasks” and lock up the main thread, making your site sluggish. Therefore, tear these big tasks into bite-size chunks that occasionally yield to the main thread.
Break Tasks with setTimeout
A common trick is setTimeout with a 0-millisecond delay. It pushes the task to the end of the queue, letting the browser tackle essential tasks (like responding to taps) in the meantime. However, since the task is deferred, it can land later than expected and shift your site’s responsiveness into an unpredictable rhythm.
Modern Yielding with the Scheduler API
The Scheduler API is the sleek, modern tool for timing tasks that works great with async code.
- scheduler.postTask(): Kick things off with one of three priorities: user-blocking (first in line), user-visible (the everyday setting), or background (the slow lane). It’s like telling the browser which tasks matter most.
- scheduler.yield(): Drop this into async functions to hand control back to the main thread without losing a beat. When you await scheduler.yield(), the function pauses, allows the browser to finish other urgent tasks, then zips back in with top priority.
Example: Yielding Function
Since scheduler.yield() doesn’t run in every browser yet, code this so it has a quick backup using setTimeout.
JavaScript
/**
* Yield back to the browser so it can update the UI
* and handle user input. Uses scheduler.yield()
* if it’s there, and falls back to setTimeout.
*/
function yieldToMain() {
    if ('scheduler' in window && 'yield' in window.scheduler) {
        return window.scheduler.yield();
    }
    return new Promise(resolve => setTimeout(resolve, 0));
}
Tweak Event Callbacks
The quickest path to a better Input Delay (INP) score is to speed up the code you run in event listeners. Therefore, keep handlers tiny.
Give the Heavy Lifting to the Background
Any part of the code that handles an event should only do the little bit of work that lets the user see something right away. If there’s a task that takes a lot of time, pause it and let the web page handle it quietly. That way, the click feels speedy, no matter what’s loading out of sight.
Speeding Up a Form That’s Dragging
Forms that try to do everything right after a submit are a classic reason for slow INP, which would annoy any user. Here’s a fast way to fix it.
- HTML Skeleton:
HTML
Top of Form

Name:   Submit

Bottom of Form- Old Way: One Heavy, Slow Job
This code tries to do every single bit of work in one heavy lump, which freezes everything until the server responds.
JavaScript
const form = document.getElementById('data-form');

form.addEventListener('submit', (event) => {
    event.preventDefault(); // Don’t let the browser submit the form the usual way
    // All of this runs in a single, freezing chunk.
    // The page stays stuck until the fetch is complete.
    const formData = new FormData(form);
    const data = Object.fromEntries(formData);
    fetch('/api/submit', {
        method: 'POST',
        headers: { 'Content-Type': 'application/json' },
        body: JSON.stringify(data)
    })
    .then(response => response.json())
    .then(result => { // The UI only changes after everything is done.
        document.getElementById('status-message').textContent = 'Success!';
    })
    .catch(error => {
        document.getElementById('status-message').textContent = 'Error!';
    });
});
- Now: A Refresh Handler
This fresh code gives quick user feedback and keeps the main thread open, bumping our INP score right up.
JavaScript
const form = document.getElementById('data-form');
const submitBtn = document.getElementById('submit-btn');
const spinner = document.getElementById('spinner');
const statusMsg = document.getElementById('status-message');

// Speed things up with an async function
form.addEventListener('submit', async (event) => {
    event.preventDefault(); // 1. Stop the browser from sending the form

    // 2. Give instant feedback (this happens right now)
    submitBtn.disabled = true;
    spinner.style.display = 'block';
    statusMsg.textContent = ''; // Clear out any old messages

    // The main thread is now open for other stuff. The INP metric is already happy.
    try {
        // 3. Handle heavy/asynchronous work (network request)
        const fd = new FormData(form);
        const res = await fetch('/api/submit', {
            method: 'POST',
            body: fd,
            headers: { 'Accept': 'application/json' }
        });

        if (!res.ok) {
            throw new Error('Network response was not ok.');
        }

        const data = await res.json();

        // 4. Update UI with the final result
        statusMsg.textContent = 'Success! Your data was sent.';
        form.reset();
    } catch (error) {
        statusMsg.textContent = 'Oops! We couldn’t send your data. Please try again.';
    } finally {
        // 5. Clean up the UI state
        submitBtn.disabled = false;
        spinner.style.display = 'none';
    }
});
Cut Down on DOM Size
Even if the JavaScript runs super-fast, a huge and tangled Document Object Model (DOM) still slows everything down when the page tries to show new content. Therefore, keep it lean.
Why a Big DOM Hurts
Whenever an action on the page wants to show something new, the browser has to refigure what everything looks like. If the DOM is stuffed (Lighthouse warns us when it has more than 1,400 nodes), this layout step takes a long time. Simply put, the more nodes there are, the more the browser has to calculate over and over.
Try the CSS content-visibility Trick
One helpful CSS property, called content-visibility, can help the browser skip the heavy work on invisible parts of the page, so your updates are snappy.
content-visibility: auto;: Add this rule to a web-page element to tell the browser, “Skip this for now.” If the item’s off-screen, the browser won’t waste time drawing or re-styling it. When it slides in, the content pops in instantly, using almost no CPU cycles at that moment.- Use it on big lists or social media feeds; this rule makes the loading phase quicker. Consequently, no on-screen tap forces the browser to recheck thousands of hidden items at once.
Code Example: CSS Containment
Yet there’s a catch: the hidden item makes its computed height zero, and that change can jerk the scrollbar. Fix this jump by adding contain-intrinsic-size. With it, you set a minimum height that holds space, so the scrollbar moves smoothly even when items pop in later.
CSS
/* Great for lengthy pages where content is hidden until in view, like articles or product grids */
.story-area {
    /* Tells the browser, “Only render this when it’s about to be seen” */
    content-visibility: auto;
    /* Sets a ghost height to keep the page stable and scrollbars quiet */
    contain-intrinsic-size: 800px; /* Tweak this to roughly the actual height you expect */
}
Wrap-Up: Team-Up for Speed
Key Takeaways
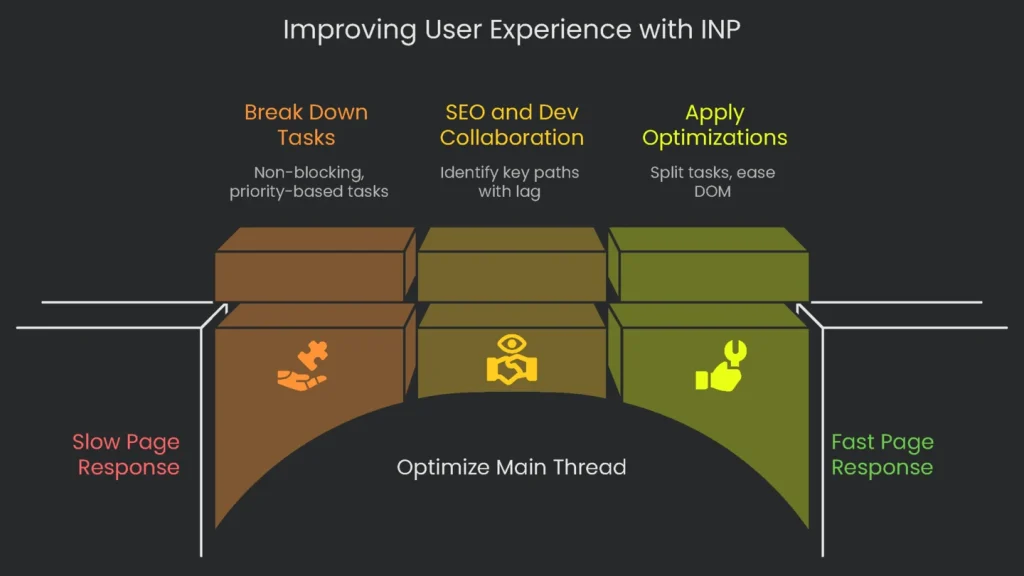
Getting the page ready to respond faster—before the next render—means protecting the browser’s main thread. Keep that thread clear so it can react to clicks, taps, and keystrokes without delay. Therefore, break work into bite-sized, non-blocking, and priority-based tasks.
Next Steps
To hit a decent INP score, SEOs and front-end coders must work side by side. SEOs can sift real-user data to find the key paths where taps lag. Devs then dig in to spot the root causes and apply the best in-the-field optimizations. In short, shifting to INP raises user experience to a new level. Split long tasks into smaller chunks, use non-blocking event handlers, and ease DOM complexity, and your sites will tick the boxes on Google’s Core Web Vitals and feel snappy to your visitors. If your organization wants to nail this, working with a pro team like Technicalseoservice brings top-notch advice that unlocks lightning-fast performance and boosts your search results, too.
Implementation steps
- Look at user interactions: find long JavaScript tasks and rainbow-size blockers from event listeners.
- Break up code bundles; lazy-load non-essential parts. Priority first on the parts that stop forms, buttons, and clicks.
- Shuffle expensive tasks off the main UI thread. Use Web Workers, or push them to run after the page paints.
- Audit third-party scripts: cut or pause the ones that don't add real user value.
- Check progress using real-user Input Navigation Performance scores and Lighthouse’s timespan tests
Frequently Asked Questions
What’s INP?
It stands for Interaction to Next Paint and measures how quickly the page responds to a user action.
What’s a good INP score?
Keep it under 200 ms; 200 to 500 ms needs work, and anything over 500 ms is poor.
How do I boost INP?
Chop up big main-thread tasks, split script bundles, and let input tasks run sooner.
Where can I watch it?
Get field data through GSC CWV or a RUM tool; or run Lighthouse in timespan mode.
Do third-party scripts drag down INP?
Definitely—keep, defer, or shift them off the main thread.