
Server logs show what real bots do when crawling your site. Learn to discover fixable, real crawlable waste of orphaned urls, and prioritize site-wide maintenance.
Tech folks doing SEO juggle many tools to track how websites tick. Site crawlers run robot-like tours that mimic search engines. Google Search Console (GSC) also hands out tidy reports. Both help, but they often stop at the headlines. Think of them as trail maps—neat and colorful, yet missing the hidden valleys and slopes. The full, unfiltered track of the search engine’s journey sits quietly on the web host. Therefore, peek at the server log files. Picture these logs as a race car’s dashboard recorder with no one cutting the tape. It’s raw footage of every page hit, every bot request, and every millisecond of lag. No one is snipping out the spikes during a holiday sale or the bot crawlers. As a result, logs tell the unembellished story of how search engines, users, and other robots interact with every pixel.
What Are Server Logs?
What a Log Records
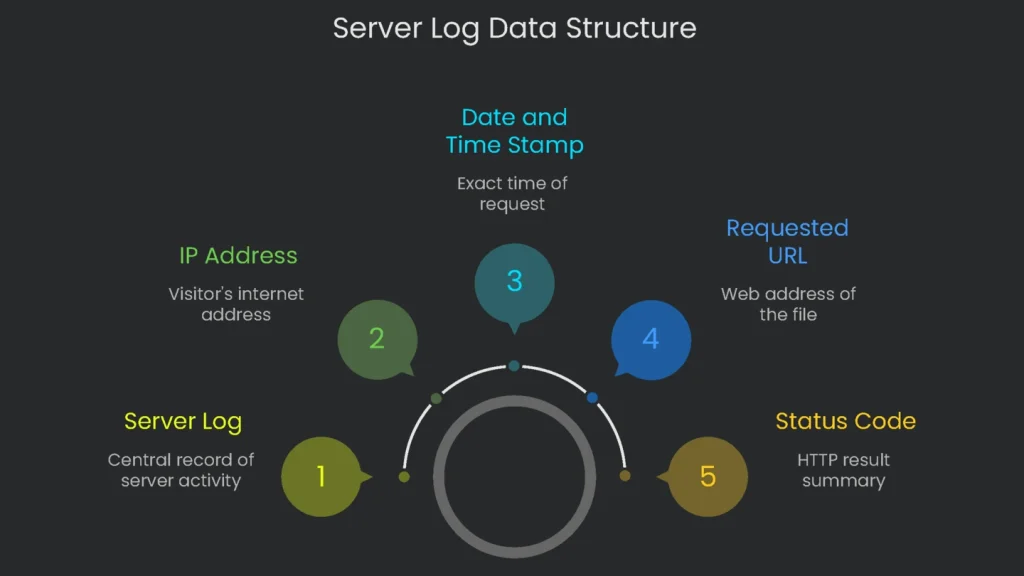
Think of a server log as a diary for a web server. Each time a visitor—whether a person’s browser or a Google bot—pings the server for a file, the server writes a new line. In short, it notes, “At this second, someone asked for this file.” The log covers everything from pages to images, videos, and style sheets. Each line packs useful data into a single plain-text row.
Core Fields You’ll See
- IP address: The visitor’s internet street address.
- Date and time stamp: Exact month, day, hour, minute, and second.
- Requested URL: The exact web address for the file.
- Status code: An HTTP status code that summarizes the result (200, 404, etc.).
- User agent: A user agent string that identifies the browser or bot.
Why Log Files Are the True Source of Truth
GSC vs. Logs
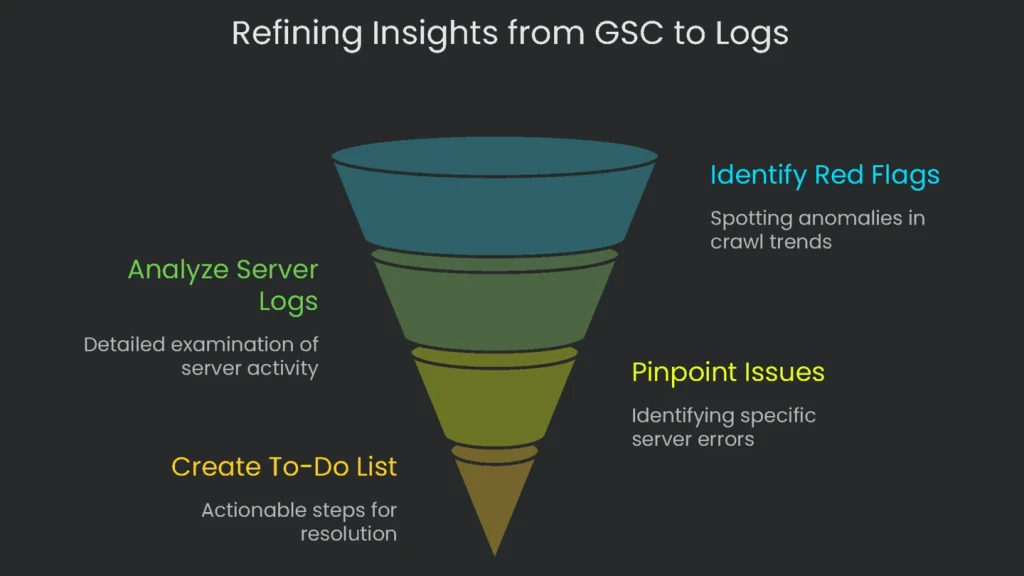
Google Search Console is helpful, but it offers a snapshot. Therefore, it is great for quick checks on trends. The catch is simple: it does not record every page request it sees. Log files, however, capture every request by every crawler in real time. They are not influenced by browser extensions or ad blockers that skew other tools. Consequently, logs provide the original proof of what the crawler and the server actually did, down to the millisecond.
From Signal to Action
Pair GSC and logs for a near foolproof workbench. For example, treat a GSC report—like this crawl budget guide—as a headline. If GSC shows fewer pages crawled on a day, that’s a red flag. Next, check the server logs for that date. The logs often reveal server errors or looping redirection that blocked progress. As a result, log analysis turns broad hints into a precise to-do list.
How to Get the Log Files You Need
Request the Logs the Right Way
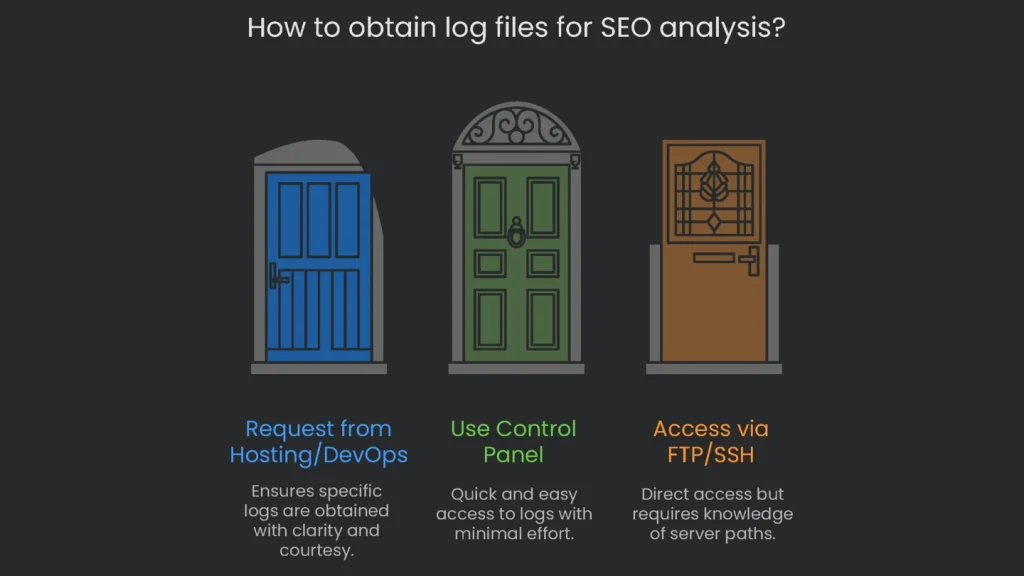
If you lack direct server access, ask the hosting or DevOps team to pull the logs. Be clear and courteous, yet specific about the SEO goal. Therefore, explain that you want to see what search engines crawl, find broken links, and improve site health. For example: “To analyze and improve our organic search metrics, can you share the complete raw web server access logs for example.com from the past 30 days? The Combined Log Format is best so I don’t have to rework the fields later. Thanks for your help.” This request removes guesswork and speeds delivery.
Where to Find Your Log Files
The easiest route is often your control panel. Programs like cPanel and Plesk let you download logs in a few clicks. Alternatively, pull logs via FTP or SSH. However, folder names differ by server. Therefore, a quick search may be required. Here is a summary of common paths.
| Platform/Server | Path to Access Logs |
| cPanel | /usr/local/apache/domlogs/$DOMAIN or through the GUI: Metrics > Raw Access |
| Plesk (Linux) | /var/www/vhosts/$DOMAIN/logs/access_log or via the GUI: Websites & Domains > Logs |
| Apache (Linux) | /var/log/apache2/access.log or /var/log/httpd/access_log |
| Nginx (Linux) | /var/log/nginx/access.log |
Breaking Down Log Formats
Server logs are plain-text files that follow a format tools can parse. For web servers, you will see two common types.
- Common Log Format (CLF): The classic layout with essential info for each request.
- Combined Log Format: An extended CLF that adds the Referrer and the User-Agent fields.
The Referrer shows where the request came from, and the User-Agent shows who is making it. Whenever you set up logging, choose the Combined Log Format.
| Part | Sample | Why It Matters for SEO |
| Remote Host | 66.249.66.1 | Identifies the machine making the request. We use it to check if the crawler is genuine. |
| Date-Time | Records the full date and hour. We track crawl intervals and how fast engines discover fresh pages. | |
| Access Command | “GET /posts/how-you-can-help-animals/ HTTP/1.1” | Pinpoints the exact page requested. It reveals which article attracts Search. |
| Access Result | Shows how the server responded. A 200 is healthy; 404 and 503 indicate crawl issues. | |
| Size Sent | page loaded | Lists kilobytes sent. A large size can signal a page that could load slowly and drain crawl budget. |
| Referrer | “https://www.google.com/“ | Shows which page invited the crawler. Some requests skip the header, yet it can reveal discovery paths. |
| Web-Viewer (User-Agent) | “Mozilla/5.0 (compatible; Googlebot/2.1; +http://www.google.com/bot.html)” | Indicates a browser or bot. A verified user agent helps confirm legitimacy. |
Picking the Right Analysis Tool
Why Not Use a Basic Editor
Open a huge log in a simple editor and it will freeze. A spreadsheet will hit row limits and crawl. Consequently, common tools waste time. You need software that chews logs at scale and serves tidy graphs.
The Winning Choice: Screaming Frog
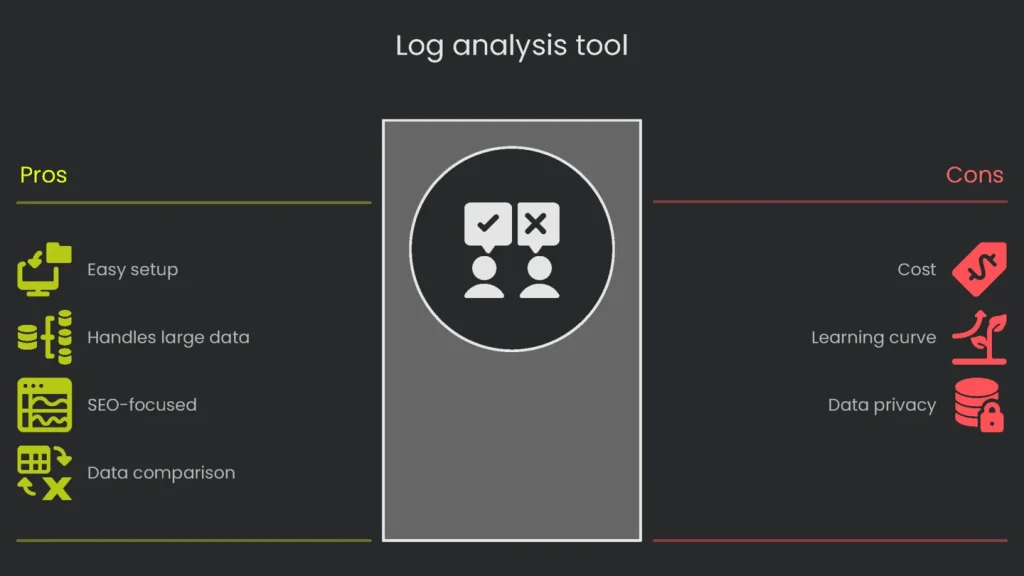
For SEOs ready to level up, the log file analysis tool is the bridge from “okay” to “whoa.” Built by specialists, it slices big data into digestible views: crawl counts, status codes, and actionable hints. Therefore, grab the tool, grasp the data, and stop guessing what crawlers do.
Why you might try this tool:
- Easy to get going: It runs on Windows, macOS, and Linux. Drag and drop your files. No command line required.
- Handles the heavy lifting: Millions of events are fine. It stores data in a local database so you can explore it without delays.
- Designed for SEOs: Tabs and reports answer crawl questions fast—response codes, redirect chains, and error types.
- Supercharged comparisons: Pair external data with event logs. Export a CSV from the free SEO Spider, import it, and spot ghost pages, missing redirects, or accidental robots exclusions fast.
The real power appears when you view log data alongside site crawl data and sitemap data. Consequently, most technical SEO puzzles surface in the gaps between these three datasets. Here’s what to watch for:
- Orphan Pages: URLs that appear in logs but not in the site crawl. Google can find them, yet they lack internal links.
- Uncrawled Pages: URLs in the site crawl that show zero log hits. The page has links, but Googlebot skipped it.
- Ignored Sitemap URLs: URLs listed in the XML sitemap that show no crawls. This can signal low value or a technical block.
5 Big SEO Lessons from Logs
Stop Wasting Crawl Budget
What Is Crawl Budget?
Crawl budget is the cap on how many pages Googlebot visits over a period. It depends on site size, health, and authority. On large sites, you want that limit focused on pages that add value. Otherwise, Googlebot may ignore the pages you want to promote.
How Logs Reveal Waste
Log analysis shows exactly where Googlebot spends its time. Therefore, highlight Googlebot visits and find pages siphoning crawl energy. Four crawl-budget drains to watch:
- Parameter madness: URLs with
?and random parameters can create a duplicate jungle—especially on e-commerce filters. - Canonical confusion: Import crawl data and review
rel="canonical"tags. If bots still crawl originals, you are teaching the same lesson repeatedly. - Redirect rope: Every 301 or 302 hop forces extra work. Logs expose each redirect hit.
- Dead-weight content: Sort crawls by directory to find low-value sections. Either retire them, add a strong noindex, or re-skin them to add value.
Check Page-Frequency Scans and Priorities
The Idea
When bots check a page often, the page is important. Fresh news, strong backlinks, or authority can raise frequency. Conversely, stale pages get fewer visits.
How to Examine the Page
Use Screaming Frog to count Googlebot visits per URL. Next, group by directory for the last month. You will see how Google sets priorities.
What the Results Mean
Look for these patterns:
- Busy pages: Home, key service pages, and recent posts should be crawled often. Daily hits are healthy.
- Slow pages: Monthly crawls on key pages are a warning. Check internal links first; they may need a boost.
- Dead pages: Valuable sitemap URLs with zero visits are invisible. Therefore, fix discovery or linking.
| Crawl Trend | What Google Is Thinking | What You Should Do Next |
| Regular & Solid (daily visits to key pages) | “Here’s valuable content that usually gets updated.” | Keep refreshing, add internal links, and maintain strong signals. |
| Few & Random (month-long gaps on a key page) | “This content seems stale or poorly linked.” | Strengthen internal links, add small updates, and earn external links. |
| Jump in Visits | Could signal a popular update or a parameter issue. | Review the surged URLs, check parameters, and curb duplicates. |
| Huge Drop | “Crawl error? Or reduced value.” | Check robots.txt blocks, server errors, and linking changes. |
Uncover Hidden Crawl Errors
Site crawlers spot broken internal links, but they miss issues only Googlebot encounters. Google uses links from other sites and its historical index. If those links point to removed pages, you get a 404 error. That wastes crawl budget and signals neglect. Therefore, scan log files for every 4xx and 5xx error. A quick filter creates a ranked fix list:
- 404 Not Found: Sort by hit count. Fix top offenders first. Set a 301 to a live, related page to preserve equity and guide bots.
- 5xx errors: These are worse than 404s. Frequent 500s tell Google your server struggles. Consequently, Google crawls less. Resolve 5xx issues fast.
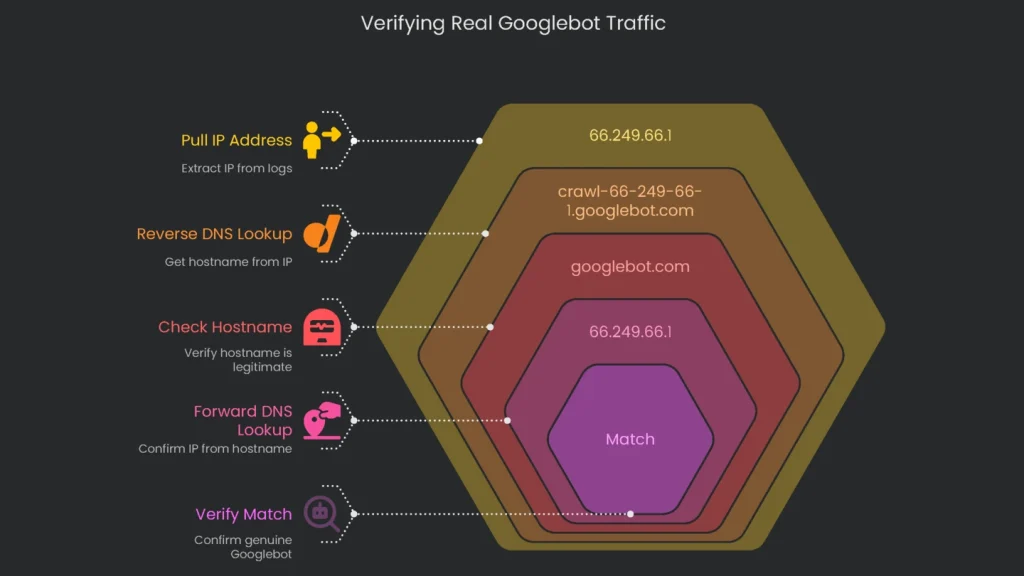
Make Sure Bots Are the Real Deal
Many bad bots pretend to be “Googlebot.” If you trust the fake ID, your reports go off course. Therefore, verify the IP against Google’s current IP list to confirm real Googlebot traffic.
Follow this checklist:
- Pull the IP address: Copy the IP from a “Googlebot” user-agent in your logs (for example, 66.249.66.1).
- Run a Reverse DNS lookup: Get the hostname tied to that IP.
- Check the hostname: It should end in
googlebot.comorgoogle.com(for example, crawl-66-249-66-1.googlebot.com). - Do a Forward DNS lookup: Look up the hostname to confirm the IP.
- Verify the match: If the IPs match, you have a genuine Googlebot.
Keep Tabs on New Content Discovery Speed
How to Measure Discovery Speed
When you publish a new article, note the URL and exact time. Then, check server logs daily and find the first visit by a confirmed Googlebot. The gap between publish time and that visit is your discovery time.
What This Tells You
- Quick discovery (minutes or hours): Reassuring. Your sitemap works, internal links help, and crawl budget is used wisely.
- Slow discovery (days or weeks): Red flag. The URL may be missing from the sitemap, lacks internal links, or crawl time is wasted elsewhere.
Become a Technical SEO Pro
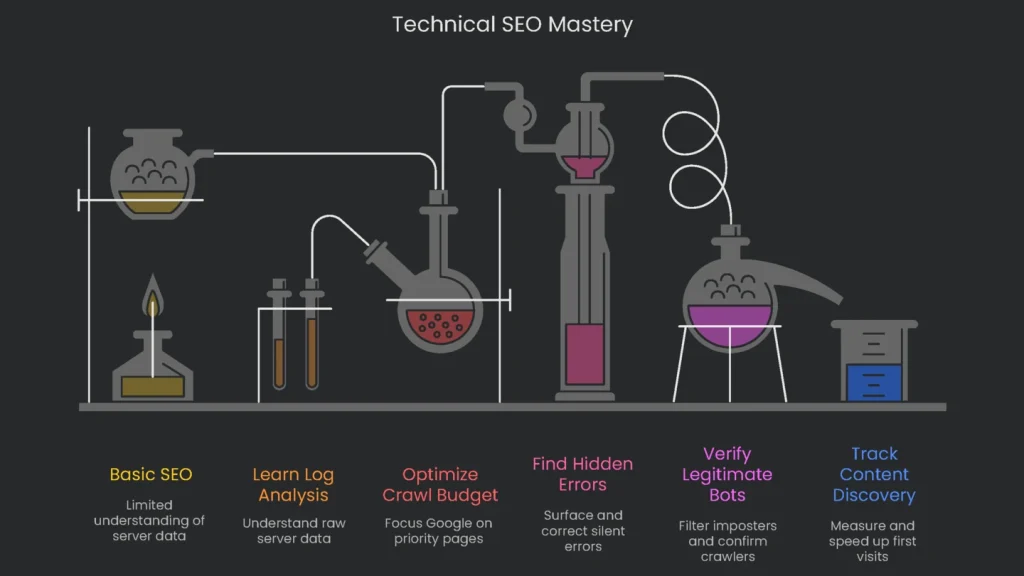
Why It Matters
Log file analysis is a milestone for any SEO ready to level up. It is the bridge between basics and advanced technical work. When you read raw server data, you see how search engines interact with your site in real time. Therefore, with the right tools and a clear plan, any dedicated SEO can mine key insights from those rows.
What You Gain
Nail this skill and you will:
- Optimize Crawl Budget: Halt unnecessary requests so Google focuses on priority pages.
- Understand Crawl Priorities: See which sections Google visits most often.
- Find and Fix Hidden Errors: Surface silent 4xx and 5xx waves and correct them.
- Verify Legitimate Bots: Filter imposters and confirm the crawlers that matter.
- Track Content Discovery: Measure and speed up first-visit times for new posts.
These are not cosmetic tweaks; they are foundational moves that shift indexing, ranking, and organic traffic in the right direction. Our deep-dive technical SEO audits include full log file analysis. Consequently, you get a clear, raw view of how your site stacks up. Reach out to Technicalseoservice now and see your site from Google’s front-row seat.
Implementation steps
- Pull and export your server logs, then filter to show only Googlebot and Bingbot requests, especially the ones with codes 200, any 3xx, 4xx, or 5xx.
- Group hits by URL pattern to flag wasted crawl—the kind caused by session IDs, facets, or duplicate sorting.
- Look for spikes in 404 or 5xx errors and pinpoint which pages load slowly; fix those with the most hits times their real impact.
- Guide bots to key pages by reinforcing internal links and getting rid of dangling or infinite URLs.
- Do the full process every month, or any time the site moves, and check how Crawl Stats change
Frequently Asked Questions
What is log file analysis?
It means digging through server logs to see how search engines and visitors really crawl through the site.
Why should I do it?
This uncover crawl waste, find hidden or orphan pages, and identify slow spots or errors.
What do I look for?
Check for how bots behave, spot spikes of 404 or 500 errors, find parameter issues, and see important pages that bots missed.
How do I get started?
Export your logs, filter to get only bot entries, and break down the hits by URL and error code with charts.
How often should I check logs?
For big or frequently updated sites, check them once a month; during site migrations or outages check even more often.